Tables and Graphs
In mathematics, tables and graphs are used to organize data and represent it visually. They are important tools for understanding and analyzing numerical information. Here's a breakdown of each concept:
Tables
A table is a way of organizing data using rows and columns. The data is arranged in a systematic way that makes it easy to read and understand. Each row represents a different set of related information, and each column represents a different category or variable. Tables can be used to compare different sets of data, track changes over time, and more.
Graphs
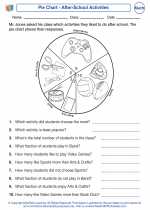
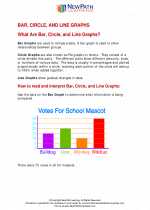
Graphs are visual representations of data, often used to show the relationship between different variables or to track changes over time. There are different types of graphs, including bar graphs, line graphs, and pie charts. Each type of graph is used for different purposes, such as comparing quantities, showing trends, or displaying proportions.
Study Guide
Here are some key points to remember when studying tables and graphs:
- Understand the different parts of a table, including the rows, columns, and headers.
- Learn how to read and interpret the information presented in a table.
- Practice creating tables to organize data from word problems or real-life situations.
- Explore the different types of graphs and their uses, such as bar graphs for comparing quantities and line graphs for showing trends over time.
- Practice creating graphs based on given data and interpreting the information they represent.
- Understand the importance of labeling and scaling in graphs to ensure accurate representation of data.
By mastering tables and graphs, you'll be able to effectively analyze and present numerical information in various contexts.
. Create and Print your own Math Worksheetswith Math Worksheet Generator
◂Math Worksheets and Study Guides Fourth Grade. Tables and Graphs
 Activity Lesson
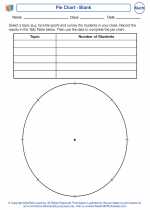 Activity Lesson
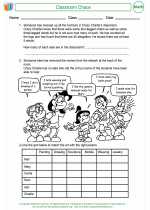 Activity Lesson
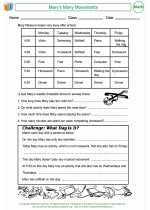 Worksheet/Answer key
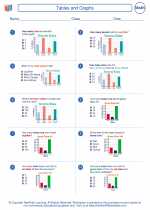 Worksheet/Answer key
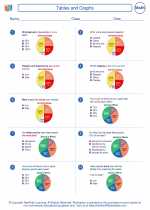 Worksheet/Answer key
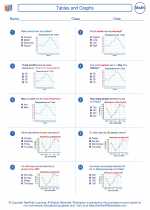 Worksheet/Answer key
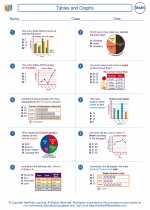 Worksheet/Answer key
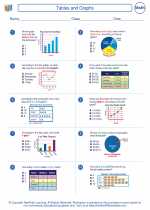 Worksheet/Answer key
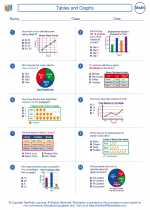 Worksheet/Answer key
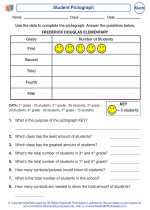 Worksheet/Answer key
 Worksheet/Answer key