Tables
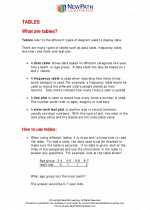
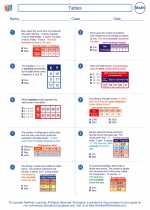
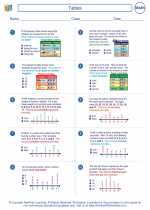
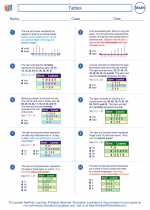
In mathematics, a table is a set of numbers or information organized in rows and columns. It is used to present data in a structured and easy-to-read format. Tables are commonly used in various mathematical concepts, such as representing data, organizing information, and solving problems.
Components of a Table
A table consists of the following components:
- Rows: Horizontal lines of data.
- Columns: Vertical lines of data.
- Header: The top row of the table that typically contains titles for each column.
- Cell: Each individual box within the table where a row and column intersect.
Types of Tables
There are different types of tables, including:
- Numeric Tables: These tables contain numerical data.
- Frequency Tables: Used to organize and display the frequency of values in a data set.
- Two-Way Tables: Also known as contingency tables, used to display the relationship between two categorical variables.
Using Tables in Mathematics
Tables are commonly used in various mathematical concepts, such as:
- Data Representation: Organizing and presenting collected data in a tabular format.
- Functions: Displaying values of a function for different inputs.
- Probability: Creating probability tables to represent outcomes of events.
Study Guide
Here are some key points to remember when working with tables:
- Understand the components of a table: rows, columns, headers, and cells.
- Practice creating and interpreting different types of tables, such as numeric, frequency, and two-way tables.
- Learn to use tables to represent and analyze data in various mathematical contexts.
- Understand how to calculate and interpret data presented in tables.
- Practice solving problems using information presented in tables.
with Math Worksheet Generator
◂Math Worksheets and Study Guides Sixth Grade. Tables
The resources above cover the following skills:
Data Analysis and Probability (NCTM)
Select and use appropriate statistical methods to analyze data.
Discuss and understand the correspondence between data sets and their graphical representations, especially histograms, stem-and-leaf plots, box plots, and scatterplots.


