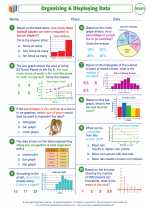
Displaying Data
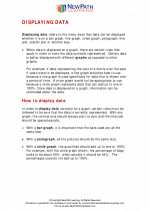
Displaying data is an important part of understanding and interpreting information. There are several ways to display data, including tables, charts, and graphs. Each method has its own advantages and is suited for different types of data.
Types of Data Displays
1. Tables: Tables are a clear and organized way to display data, especially when dealing with large amounts of information. They are useful for displaying numerical data and making comparisons between different categories.
2. Charts: Charts, such as bar charts, line charts, and pie charts, are visual representations of data. They are useful for showing trends, comparisons, and proportions within the data.
3. Graphs: Graphs, including line graphs, scatter plots, and histograms, are used to visually represent the relationship between variables. They are helpful for displaying patterns and relationships within the data.
Choosing the Right Display
When choosing a method to display data, it's important to consider the type of data and the purpose of the display. For example, if you want to compare the sales performance of different products over time, a line chart would be a good choice. If you want to show the distribution of ages in a population, a histogram would be more appropriate.
Study Guide
Key Concepts
- Understanding the different types of data displays
- Knowing when to use tables, charts, and graphs
- Interpreting the information presented in each type of display
- Choosing the right display for a given set of data
Practice Questions
- What are the advantages of using a table to display data?
- When would you use a bar chart instead of a line chart?
- How can a histogram help in understanding the distribution of a data set?
- Give an example of a real-world situation where a scatter plot would be useful.
Practice Problems
1. Create a bar chart to display the sales figures for the following products:
| Product | Sales |
|---|---|
| A | 150 |
| B | 200 |
| C | 100 |
2. Use a line graph to show the temperature variations over a week with the following data:
| Day | Temperature (°C) |
|---|---|
| Monday | 25 |
| Tuesday | 28 |
| Wednesday | 26 |
| Thursday | 24 |
| Friday | 30 |
| Saturday | 29 |
| Sunday | 27 |
3. Create a histogram to display the distribution of the following data set:
| Age Group | Number of People |
|---|---|
| 10-20 | 15 |
| 21-30 | 25 |
| 31-40 | 20 |
| 41-50 | 18 |
| 51-60 | 12 |
These practice problems will help reinforce your understanding of the different data display methods and how to use them effectively.
. Create and Print your own Math Worksheetswith Math Worksheet Generator
◂Math Worksheets and Study Guides Eighth Grade. Displaying data
 Worksheet/Answer key
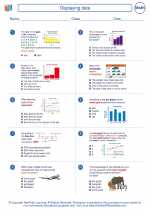 Worksheet/Answer key
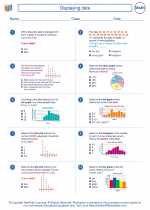 Worksheet/Answer key
 Worksheet/Answer key