Interpret Information
What is Interpreting Information? You can use maps, charts, and timelines to interpret information. Charts are visual displays of information. They reveal information through mathematical statistics. A timeline is used to show events in chronological order. A map is a drawing created to represent the world or a part of the world's surface. Read More...
◂English Language Arts Worksheets and Study Guides Fourth Grade. Interpret Information
Study Guide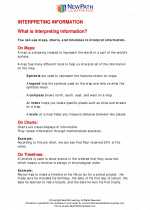 Interpret Information
  Worksheet/Answer key
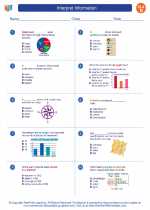 Interpret Information
  Worksheet/Answer key
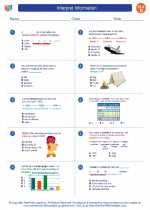 Interpret Information
  Worksheet/Answer key
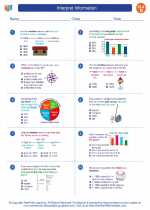 Interpret Information
  Worksheet/Answer key
 Text-Connections
  Worksheet/Answer key
 Four Square

 Worksheet/Answer key
 Worksheet/Answer key
 Worksheet/Answer key
 Worksheet/Answer key
 Worksheet/Answer key

The resources above cover the following skills:
Reading Standards for Informational Text
Integration of Knowledge and Ideas
Interpret information presented visually, orally, or quantitatively (e.g., in charts, graphs, diagrams, time lines, animations, or interactive elements on Web pages) and explain how the information contributes to an understanding of the text in which it appears. [RI.4.7]