Bar Graphs
A bar graph is a visual representation of data using bars of different heights or lengths. It is used to compare and display the values of different categories or groups.
In the example above, each bar represents a category, and the height of the bar corresponds to the value of that category. Bar graphs are often used to show trends over time, compare different groups, or display survey results.
◂Math Worksheets and Study Guides Second Grade. Fractions Greater Than or Less Than 1/2
Study Guide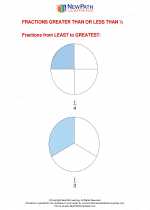 Fractions Greater Than or Less Than 1/2
  Worksheet/Answer key
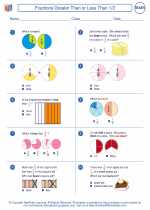 Fractions Greater Than or Less Than 1/2
  Worksheet/Answer key
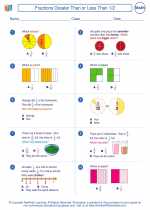 Fractions Greater Than or Less Than 1/2
  Worksheet/Answer key
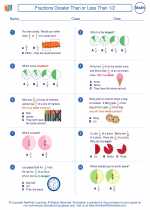 Fractions Greater Than or Less Than 1/2
  Worksheet/Answer key
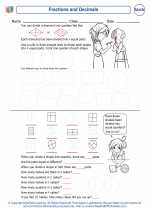 Fractions and Decimals
  Worksheet/Answer key
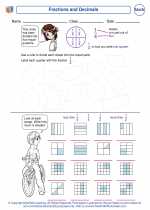 Fractions and Decimals
  Vocabulary/Answer key
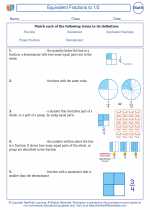 Fractions Greater Than or Less Than 1/2

 Worksheet/Answer key
 Worksheet/Answer key
 Worksheet/Answer key
 Worksheet/Answer key
 Worksheet/Answer key
 Vocabulary/Answer key

Create And Print more Fractions worksheets with Comparing Fractions, Equivalent Fractions, and Simplifying Fractions
The resources above cover the following skills:
Number and Operations (NCTM)
Understand numbers, ways of representing numbers, relationships among numbers, and number systems.
Understand and represent commonly used fractions, such as 1/4, 1/3, and 1/2.