Scatter Plot
A scatter plot is a type of mathematical diagram that uses Cartesian coordinates to display values for two variables for a set of data. The data is displayed as a collection of points, each having the value of one variable determining the position on the horizontal axis and the value of the other variable determining the position on the vertical axis.
Scatter plots are used to investigate the relationship between two variables and to identify any patterns or correlations that may exist in the data. They are especially useful for identifying trends, clusters, and outliers in the data.
To create a scatter plot, you simply plot each pair of data points on the coordinate plane, with one variable's values on the x-axis and the other variable's values on the y-axis. Once all the points are plotted, you can visually analyze the distribution of the data and determine if there is a relationship between the two variables.
Scatter plots are commonly used in various fields such as statistics, economics, science, and engineering to visually represent and analyze data. They are a powerful tool for exploring and understanding the relationship between two variables.
Overall, scatter plots provide a visual representation of the relationship between two variables, making it easier to interpret and analyze the data.
.◂Math Worksheets and Study Guides Second Grade. Fractions Greater Than or Less Than 1/2
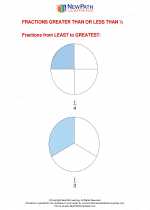
 Worksheet/Answer key
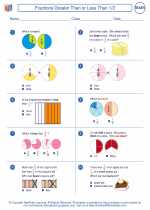
 Worksheet/Answer key
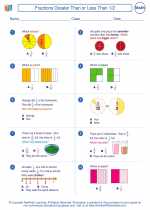
 Worksheet/Answer key
 Worksheet/Answer key
 Worksheet/Answer key
 Vocabulary/Answer key