Line Chart
A line chart is a type of graph that displays information as a series of data points, called 'markers,' connected by straight line segments. It is commonly used to show trends and relationships over time.
Key Elements of a Line Chart
- X-axis: The horizontal axis that represents the independent variable, such as time, categories, or other ordered data.
- Y-axis: The vertical axis that represents the dependent variable, such as numerical values or counts.
- Data Points: Individual points on the chart that represent specific values of the variables being measured.
- Line: The line that connects the data points, showing the trend or pattern in the data.
- Title and Labels: The chart should have a title and labels for the x-axis and y-axis to provide context and clarity.
How to Create a Line Chart
- Collect Data: Gather the data points that you want to represent on the chart.
- Choose the Variables: Determine which variable will be represented on the x-axis and which will be on the y-axis.
- Scale the Axes: Determine the range and scale for each axis to best display the data.
- Plot the Points: Plot each data point on the chart using the appropriate coordinates.
- Connect the Points: Draw a line that connects the data points, showing the trend or pattern in the data.
- Add Titles and Labels: Include a title and labels for the axes to provide context for the chart.
Study Guide
To understand line charts better, consider the following study guide:
- What are the key elements of a line chart?
- How are line charts different from bar charts and pie charts?
- When is it appropriate to use a line chart to represent data?
- Explain the process of creating a line chart using a specific example.
- What are some best practices for labeling and titling a line chart?
- Provide examples of real-world situations where line charts are commonly used.
Understanding line charts is an essential skill for interpreting and communicating data in various fields, including business, science, and social studies.
.◂Math Worksheets and Study Guides Third Grade. Solids and Faces
Study Guide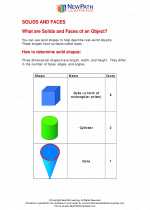 Solids and Faces
  Worksheet/Answer key
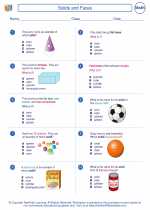 Solids and Faces
  Worksheet/Answer key
 Solids and Faces
  Worksheet/Answer key
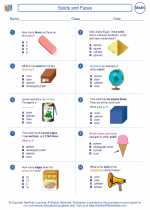 Solids and Faces
  Worksheet/Answer key
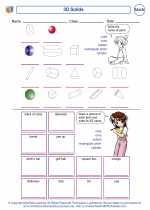 3D Solids
  Worksheet/Answer key
 3D Space

 Worksheet/Answer key
 Worksheet/Answer key
 Worksheet/Answer key
 Worksheet/Answer key
 Worksheet/Answer key

The resources above cover the following skills:
Geometry (NCTM)
Analyze characteristics and properties of two- and three-dimensional geometric shapes and develop mathematical arguments about geometric relationships.
Identify, compare, and analyze attributes of two- and three-dimensional shapes and develop vocabulary to describe the attributes.
Classify two- and three-dimensional shapes according to their properties and develop definitions of classes of shapes such as triangles and pyramids.
Use visualization, spatial reasoning, and geometric modeling to solve problems.
Recognize geometric ideas and relationships and apply them to other disciplines and to problems that arise in the classroom or in everyday life.