What is a Histogram?
A histogram is a graphical representation of the distribution of numerical data. It consists of a series of vertical bars, where each bar represents a range of values, and the height of the bar corresponds to the frequency or count of the values within that range.
How to Create a Histogram
- Organize the Data: Start by organizing the numerical data into intervals or "bins".
- Count the Frequency: Count the number of data points that fall into each interval.
- Draw the Bars: Draw a bar for each interval, where the width of the bar represents the interval and the height represents the frequency.
- Add Labels: Label the x-axis with the intervals and the y-axis with the frequency or count.
- Add Title: Include a title that describes the data being represented.
Key Concepts
When working with histograms, it's important to understand the following key concepts:
- Frequency: The number of data points that fall into a particular interval.
- Interval: A range of values that is represented by a single bar in the histogram.
- Width of the Bar: Represents the range of values for each interval.
- Height of the Bar: Represents the frequency or count of the values within the interval.
Uses of Histograms
Histograms are commonly used in data analysis to visualize the distribution of data and identify patterns or outliers. They are frequently used in fields such as statistics, economics, and quality control to understand the frequency distribution of a dataset.
Study Guide
When studying histograms, make sure to focus on the following areas:
- Understanding how to organize data into intervals and calculate the frequency for each interval.
- Interpreting the shape of the histogram and what it reveals about the data distribution (e.g., symmetrical, skewed, bimodal).
- Identifying outliers or unusual patterns in the data based on the histogram.
- Practicing how to create histograms from given data sets.
- Understanding the real-world applications of histograms in various fields.
By mastering these concepts and skills, you'll be well-prepared to work with histograms and interpret the distribution of numerical data effectively.
.◂Math Worksheets and Study Guides Sixth Grade. Commutative/Associative Properties
 Worksheet/Answer key
 Worksheet/Answer key
 Worksheet/Answer key
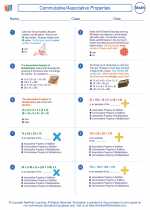
 Worksheet/Answer key