Flowcharts Study Guide
1. Basic Symbols
Flowcharts use various symbols to represent different elements in a process:
- Start/End: Indicates the beginning or end of a process.
- Input/Output: Represents data input or output.
- Process: Denotes a specific action or operation.
- Decision: Represents a conditional or branching point in the process.
- Connector: Indicates a connection to another part of the flowchart.
2. Flowchart Construction
To create a flowchart, follow these basic steps:
- Start with a start/end symbol to represent the beginning of the process.
- Add process symbols to represent the individual steps or actions in the process.
- Use decision symbols to show points where the process branches based on a condition.
- Connect the symbols with arrows to indicate the flow of the process.
- End with a start/end symbol to represent the completion of the process.
3. Reading and Understanding Flowcharts
When reading a flowchart, start at the start/end symbol and follow the arrows to understand the sequence of steps and decision points. Pay attention to the decision symbols to understand the conditions that determine the flow of the process.
4. Practice Problems
Try creating flowcharts for various processes, such as making a sandwich, solving a math problem, or completing a simple task. This practice will help reinforce your understanding of flowchart construction and interpretation.
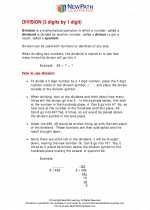
.◂Math Worksheets and Study Guides Sixth Grade. Division
Study Guide Division
  Worksheet/Answer key
 Division
  Worksheet/Answer key
 Division
  Worksheet/Answer key
 Division

 Worksheet/Answer key
 Worksheet/Answer key
 Worksheet/Answer key

The resources above cover the following skills:
Connections to the Grade 6 Focal Points (NCTM)
Number and Operations: Students' work in dividing fractions shows them that they can express the result of dividing two whole numbers as a fraction (viewed as parts of a whole). Students then extend their work in grade 5 with division of whole numbers to give mixed number and decimal solutions to division problems with whole numbers. They recognize that ratio tables not only derive from rows in the multiplication table but also connect with equivalent fractions. Students distinguish multiplicative comparisons from additive comparisons.