Linear Function Study Guide
Linear functions are a fundamental concept in mathematics. They are functions that can be represented by a straight line when graphed on a coordinate plane. The general form of a linear function is given by:
f(x) = mx + b
- m is the slope of the line, which represents the rate of change or the steepness of the line.
- b is the y-intercept, which is the point where the line crosses the y-axis.
Key Concepts:
- Slope: The slope of a linear function measures the rate at which the function is changing. It is calculated as the change in y-values divided by the change in x-values between any two points on the line.
- Y-Intercept: The y-intercept is the point where the line crosses the y-axis, and it is represented by the value of b in the function.
- Graphing Linear Functions: To graph a linear function, plot the y-intercept first, and then use the slope to find additional points to draw the line.
- Equation of a Line: The equation of a straight line in slope-intercept form is y = mx + b, where m is the slope and b is the y-intercept.
- Linear Equations: Linear functions can also be represented as equations, such as y = 3x + 2.
Practice Problems:
- Find the slope and y-intercept of the linear function: f(x) = 2x + 5
- Graph the linear function: f(x) = -3x + 4
- Write the equation of the line with a slope of 1/2 and a y-intercept of 3.
Slope (m) = 2
Y-Intercept (b) = 5
Plot the y-intercept at (0, 4), then use the slope to find additional points and draw the line.
The equation is y = (1/2)x + 3.
Real-World Applications:
Linear functions are used to model many real-world situations, such as calculating costs, predicting growth rates, and analyzing trends. Understanding linear functions is crucial in fields like economics, physics, engineering, and more.
Overall, mastering the concept of linear functions is essential for developing strong foundational skills in mathematics and its applications.
Good luck with your studies!
.◂Math Worksheets and Study Guides Sixth Grade. Probability

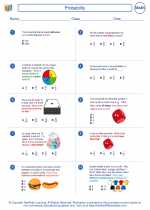
 Worksheet/Answer key
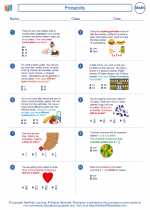
 Worksheet/Answer key
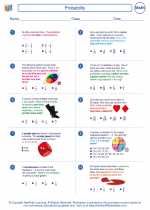
 Worksheet/Answer key
