Graphing
What is graphing?
Graphing is the process of representing data or functions visually using graphs or charts. In mathematics, graphing is often used to show the relationship between two variables or to represent functions.
Types of Graphs
There are several types of graphs commonly used in mathematics:
- Line Graphs: Used to show the relationship between two variables by connecting data points with straight lines.
- Bar Graphs: Used to compare different categories of data by using rectangular bars of varying lengths.
- Pie Charts: Used to show the parts of a whole by dividing a circle into sectors.
- Scatter Plots: Used to display the relationship between two sets of data by plotting points on a coordinate plane.
Graphing Linear Equations
When graphing linear equations, the standard form y = mx + b is often used. Here, m represents the slope of the line, and b represents the y-intercept.
To graph a linear equation, follow these steps:
- Identify the y-intercept (b) and plot the point (0, b).
- Use the slope (m) to find another point on the line. For example, if the slope is 2, move up 2 units and right 1 unit from the y-intercept and plot another point.
- Draw a straight line through the two points to represent the graph of the linear equation.
Study Guide for Graphing
To effectively study graphing, consider the following tips:
- Understand the different types of graphs and when each type is used.
- Practice plotting points on a coordinate plane to become familiar with graphing linear equations.
- Learn how to calculate and interpret the slope of a line.
- Review how to find and plot the y-intercept of a linear equation.
- Work on interpreting graphs and extracting information from them.
By mastering the concepts and skills related to graphing, you'll be able to effectively represent data and functions visually, helping you solve mathematical problems more easily.
.◂Math Worksheets and Study Guides Seventh Grade. Introduction to Probability
Study Guide Introduction to Probability
  Worksheet/Answer key
 Introduction to Probability Worksheet/Answer key
 Introduction to Probability Worksheet/Answer key
 Introduction to Probability Worksheet/Answer key
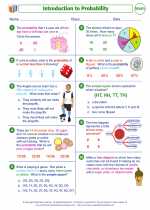 Introduction to Probability
Worksheet/Answer keyWorksheet/Answer keyWorksheet/Answer keyWorksheet/Answer keyThe resources above cover the following skills:
Data Analysis and Probability (NCTM)
Understand and apply basic concepts of probability
Use proportionality and a basic understanding of probability to make and test conjectures about the results of experiments and simulations.
Connections to the Grade 7 Focal Points (NCTM)
Probability: Students understand that when all outcomes of an experiment are equally likely, the theoretical probability of an event is the fraction of outcomes in which the event occurs. Students use theoretical probability and proportions to make approximate predictions.