Tables
In mathematics, a table is a way to organize and display data in rows and columns. Tables are commonly used to present data in an organized and easy-to-read format.
Parts of a Table
A table consists of the following parts:
- Header: The top row of the table that contains the titles of each column.
- Row: A horizontal line of cells in the table.
- Column: A vertical line of cells in the table.
- Cell: An intersection of a row and a column, containing a single piece of data.
Creating and Reading Tables
To create a table, follow these steps:
- Identify the data to be included in the table.
- Label the columns with appropriate headings.
- List the data in the corresponding rows and columns.
To read a table, start by identifying the header row and then locate the specific data point by following the row and column to the intersection point.
Uses of Tables
Tables are used for various purposes, such as:
- Organizing and presenting numerical data.
- Comparing different sets of data.
- Displaying patterns and relationships in data.
Study Guide
To master the topic of tables, it's important to:
- Understand the structure of a table, including headers, rows, columns, and cells.
- Practice creating tables based on given data.
- Learn to read and interpret tables to extract relevant information.
- Use tables to solve problems and make comparisons between data sets.
Remember to always pay attention to the organization of data and the clarity of presentation when working with tables.
.◂Math Worksheets and Study Guides Seventh Grade. Introduction to Probability
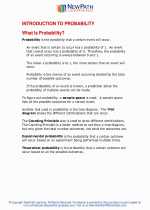
Study Guide Introduction to Probability
  Worksheet/Answer key
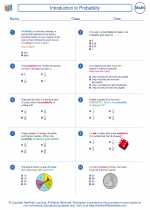
 Introduction to Probability
  Worksheet/Answer key
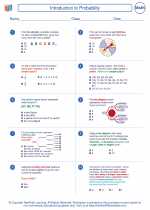
 Introduction to Probability
  Worksheet/Answer key
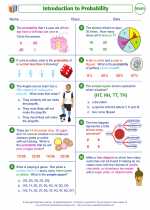
 Introduction to Probability
  Worksheet/Answer key
 Introduction to Probability

 Worksheet/Answer key
 Worksheet/Answer key
 Worksheet/Answer key
 Worksheet/Answer key

The resources above cover the following skills:
Data Analysis and Probability (NCTM)
Understand and apply basic concepts of probability
Use proportionality and a basic understanding of probability to make and test conjectures about the results of experiments and simulations.
Connections to the Grade 7 Focal Points (NCTM)
Probability: Students understand that when all outcomes of an experiment are equally likely, the theoretical probability of an event is the fraction of outcomes in which the event occurs. Students use theoretical probability and proportions to make approximate predictions.