Charts
Charts are visual representations of data, designed to make complex information easier to understand and interpret. They are commonly used in various fields, including mathematics, science, economics, and business, to present data in a clear and organized manner.
Types of Charts
There are several types of charts commonly used to represent different kinds of data:
- Bar Chart: A bar chart uses rectangular bars to represent the frequency or distribution of data categories. It is useful for comparing data across different categories.
- Line Chart: A line chart displays data points connected by straight lines. It is often used to show trends or changes over time.
- Pie Chart: A pie chart represents data as a circle divided into sections, with each section showing the proportion of each category in the overall data set.
- Scatter Plot: A scatter plot uses individual data points to represent the relationship between two variables. It is useful for identifying patterns and correlations in the data.
- Histogram: A histogram is similar to a bar chart, but it is used to represent the distribution of continuous data, such as age groups or test scores.
How to Create a Chart
To create a chart, follow these general steps:
- Identify the type of data: Determine the type of data you want to represent (categorical, numerical, time series, etc.).
- Select the appropriate chart type: Choose the chart type that best fits the data and the message you want to convey.
- Collect and organize the data: Gather the relevant data and organize it in a clear and understandable format.
- Create the chart: Use a software tool such as Microsoft Excel, Google Sheets, or specialized charting software to input the data and generate the chart.
- Label and customize the chart: Add titles, labels, and other visual elements to make the chart easy to understand and visually appealing.
- Interpret the chart: Analyze the chart to draw conclusions and insights from the data.
Study Guide
To better understand charts, consider the following study guide:
- Learn the different types of charts and their specific uses.
- Practice creating charts using real-world data sets.
- Understand how to interpret charts and draw conclusions from the data presented.
- Explore how charts are used in various disciplines, such as science, economics, and business.
- Experiment with different software tools for creating and customizing charts.
By mastering the art of creating and interpreting charts, you'll be able to effectively communicate data and insights in a visually compelling way.
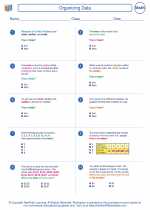
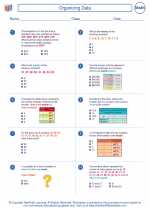
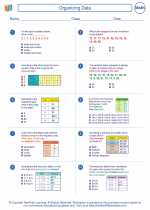
.◂Math Worksheets and Study Guides Seventh Grade. Organizing Data
Study Guide Organizing Data
  Worksheet/Answer key
 Organizing Data
  Worksheet/Answer key
 Organizing Data
  Worksheet/Answer key
 Organizing Data

 Worksheet/Answer key
 Worksheet/Answer key
 Worksheet/Answer key

The resources above cover the following skills:
Data Analysis and Probability (NCTM)
Select and use appropriate statistical methods to analyze data.
Find, use, and interpret measures of center and spread, including mean and interquartile range.