Understanding Exponential Functions
Key Components:
- Base (b): The constant multiplier in the form b^x.
- Exponent (x): The variable that represents the power to which the base is raised.
- Initial Value (a): The value of the function when x = 0.
Graphing Exponential Functions:
- To graph an exponential function, choose a set of x-values, calculate the corresponding y-values using the function, and plot the points on a graph.
- Exponential functions can have different shapes based on the value of the base "b" and whether the function represents growth or decay.
Properties of Exponential Functions:
- Exponential functions with a base greater than 1 represent growth, while those with a base between 0 and 1 represent decay.
- Exponential functions never cross the x-axis, as they are always positive for real values of x.
- Exponential growth functions increase at an increasing rate, while exponential decay functions decrease at a decreasing rate.
Applications of Exponential Functions:
- Modeling population growth or decay.
- Describing the decay of radioactive substances.
- Calculating compound interest in finance.
Practice Problems:
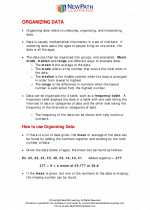
.◂Math Worksheets and Study Guides Seventh Grade. Organizing Data
Study Guide Organizing Data
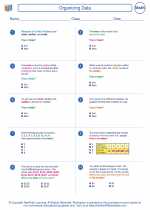
  Worksheet/Answer key
 Organizing Data
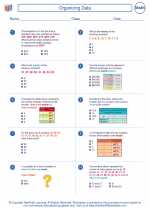
  Worksheet/Answer key
 Organizing Data
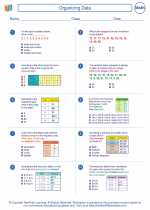
  Worksheet/Answer key
 Organizing Data

 Worksheet/Answer key
 Worksheet/Answer key
 Worksheet/Answer key

The resources above cover the following skills:
Data Analysis and Probability (NCTM)
Select and use appropriate statistical methods to analyze data.
Find, use, and interpret measures of center and spread, including mean and interquartile range.