Line Graphs
A line graph is a type of chart used to show the relationship between two variables. It is particularly useful for displaying data that changes over time. The horizontal axis represents the independent variable (often time), while the vertical axis represents the dependent variable.
Key Components of a Line Graph
- Title: A descriptive title that summarizes the data being presented.
- Axes: The horizontal and vertical lines that represent the independent and dependent variables, respectively.
- Data Points: Individual points representing the value of the dependent variable at specific values of the independent variable.
- Line: A line that connects the data points, showing the trend or pattern in the data.
- Legend: A key that explains the meaning of different lines or colors on the graph, if multiple sets of data are being compared.
Creating a Line Graph
To create a line graph, follow these steps:
- Organize your data into two columns: one for the independent variable (e.g., time) and one for the dependent variable (e.g., temperature).
- Draw the horizontal and vertical axes, labeling them appropriately.
- Plot the data points on the graph, with the independent variable values on the horizontal axis and the dependent variable values on the vertical axis.
- Connect the data points with a line to show the trend or pattern in the data.
- Add a title and legend, if necessary, to make the graph clear and understandable.
Interpreting a Line Graph
When interpreting a line graph, pay attention to the following:
- The direction of the line: Is it increasing, decreasing, or staying constant?
- The steepness of the line: A steeper line indicates a more rapid change in the dependent variable.
- Patterns or trends: Look for patterns such as cycles, trends, or irregularities in the data.
- Comparison: If there are multiple lines on the graph, compare their trends and relationships.
Study Guide
To master line graphs, consider the following study guide:
- Understand the purpose and use of line graphs.
- Practice creating line graphs from given sets of data.
- Interpret existing line graphs to identify trends and patterns.
- Compare and contrast different line graphs to understand how variables are related.
- Use technology (such as graphing software) to create and analyze line graphs.
By mastering line graphs, you will be able to effectively represent and analyze data that changes over time, making it a valuable skill in various fields such as science, economics, and social sciences.
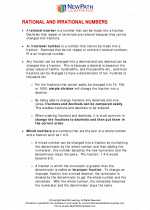
.◂Math Worksheets and Study Guides Seventh Grade. Rational and Irrational Numbers
Study Guide Rational and Irrational Numbers
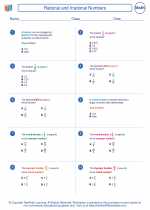
  Worksheet/Answer key
 Rational and Irrational Numbers
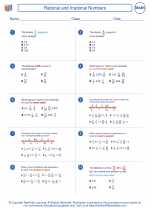
  Worksheet/Answer key
 Rational and Irrational Numbers
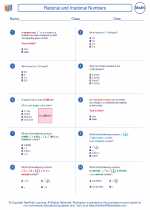
  Worksheet/Answer key
 Rational and Irrational Numbers

 Worksheet/Answer key
 Worksheet/Answer key
 Worksheet/Answer key

The resources above cover the following skills:
Connections to the Grade 7 Focal Points (NCTM)
Number and Operations: In grade 4, students used equivalent fractions to determine the decimal representations of fractions that they could represent with terminating decimals. Students now use division to express any fraction as a decimal, including fractions that they must represent with infinite decimals. They find this method useful when working with proportions, especially those involving percents. Students connect their work with dividing fractions to solving equations of the form ax = b, where a and b are fractions. Students continue to develop their understanding of multiplication and division and the structure of numbers by determining if a counting number greater than 1 is a prime, and if it is not, by factoring it into a product of primes.