Introduction to Flowcharts
Flowcharts are graphical representations of a process. They use different shapes and arrows to show the sequence of steps in a process.
Basic Flowchart Symbols
- Start/End: Indicates the beginning or end of a process.
- Process: Represents a specific action or operation in the process.
- Decision: Shows a conditional operation with two or more possible outcomes.
- Input/Output: Indicates where data enters or exits the process.
- Connector: Used to connect different parts of the flowchart.
Creating a Flowchart
To create a flowchart, follow these steps:
- Identify the process to be represented.
- Determine the start and end points of the process.
- List the steps or actions involved in the process.
- Use flowchart symbols to represent each step.
- Connect the steps using arrows to show the flow of the process.
Flowchart Examples
Here are some common examples of processes that can be represented using flowcharts:
- Algorithm for solving a mathematical problem
- Decision-making process
- Order processing system
- Flow of control in a computer program
Benefits of Flowcharts
Flowcharts offer several advantages, including:
- Clarity: They provide a clear visual representation of a process.
- Communication: They help in communicating complex processes to others.
- Analysis: They aid in identifying inefficiencies or bottlenecks in a process.
- Documentation: They serve as documentation for a process or algorithm.
Conclusion
Flowcharts are valuable tools for illustrating the flow of processes and algorithms. By using standard symbols and connecting them appropriately, complex procedures can be made easy to understand.
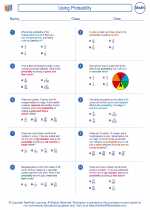
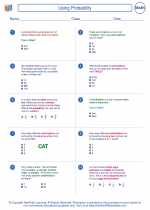
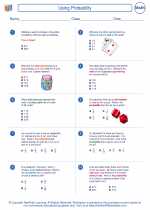
.◂Math Worksheets and Study Guides Seventh Grade. Using Probability
Study Guide Using Probability
  Worksheet/Answer key
 Using Probability
  Worksheet/Answer key
 Using Probability
  Worksheet/Answer key
 Using Probability

 Worksheet/Answer key
 Worksheet/Answer key
 Worksheet/Answer key

The resources above cover the following skills:
Data Analysis and Probability (NCTM)
Understand and apply basic concepts of probability
Compute probabilities for simple compound events, using such methods as organized lists, tree diagrams, and area models.