Numerical Observations
Numerical observations are a key aspect of mathematics and statistics. They involve collecting, organizing, and interpreting numerical data to make inferences and draw conclusions. In this study guide, we will cover various techniques and concepts related to numerical observations, including measures of central tendency, measures of dispersion, and graphical representations of data.
Measures of Central Tendency
Measures of central tendency are used to describe the center or average of a data set. The three main measures of central tendency are:
- Mean: The average of a set of numbers, calculated by adding all the values and dividing by the total count of values.
- Median: The middle value of a data set when the values are arranged in ascending or descending order.
- Mode: The value that appears most frequently in a data set.
Measures of Dispersion
Measures of dispersion quantify the spread or variability of a data set. Common measures of dispersion include:
- Range: The difference between the maximum and minimum values in a data set.
- Variance: A measure of the average squared deviation of each number from the mean of the data set.
- Standard Deviation: The square root of the variance, providing a measure of the amount of variation or dispersion of a set of values.
Graphical Representations of Data
Graphs and charts are powerful tools for visually representing numerical observations. Common types of graphical representations include:
- Bar Graphs: Used to compare different categories of data.
- Line Graphs: Show the relationship between two variables over a continuous interval.
- Histograms: Display the distribution of numerical data by dividing the data into intervals or bins.
- Box Plots: Provide a visual summary of the distribution, showing the median, quartiles, and potential outliers.
Study Guide Summary
When working with numerical observations, it is important to understand measures of central tendency, measures of dispersion, and graphical representations of data. These concepts play a crucial role in analyzing and interpreting numerical data, making them essential tools for students of mathematics and statistics.
By mastering these concepts, students will be equipped to effectively analyze and communicate numerical observations in a variety of real-world contexts.
.◂Math Worksheets and Study Guides Eighth Grade. Experimental Probability

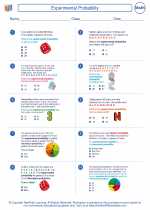
 Worksheet/Answer key
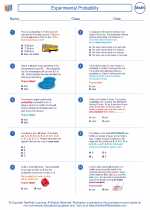
 Worksheet/Answer key
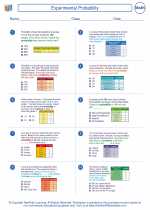
 Worksheet/Answer key
