Linear relationships -> division
Division Study Guide
Division is a fundamental operation in mathematics that involves the distribution of a quantity into equal parts. It is the opposite of multiplication and is used to find out how many times one number (the divisor) is contained within another number (the dividend).
Key Terms:
- Dividend: The number being divided.
- Divisor: The number by which the dividend is divided.
- Quotient: The result of the division.
- Remainder: The amount left over after division that cannot be evenly divided by the divisor.
Methods of Division:
- Long Division: A method of dividing one number by another using repeated subtraction and bringing down digits.
- Short Division: A quicker method of division, often used for simpler problems or with smaller numbers.
- Division with Decimals: Division involving numbers with decimal points.
Division Properties:
- Identity Property: The quotient of any number divided by 1 is the number itself.
- Zero Property: The quotient of 0 divided by any number is 0.
- Division by Zero: Division by zero is undefined in mathematics.
Division Practice:
Here are some sample division problems to practice:
Division Rules:
- To divide by a power of 10, simply move the decimal point to the left the same number of places as the number of zeros in the power of 10.
- To check your division, multiply the quotient by the divisor and add the remainder, if any. The result should be equal to the dividend.
By understanding the principles and practicing division problems, you can become proficient in this fundamental mathematical operation.
[Division] Related Worksheets and Study Guides:
.◂Math Worksheets and Study Guides Eighth Grade. Linear relationships
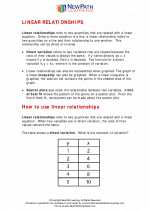
Study Guide Linear relationships
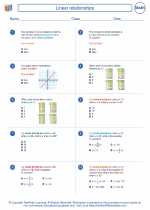
  Worksheet/Answer key
 Linear relationships
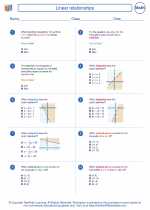
  Worksheet/Answer key
 Linear relationships
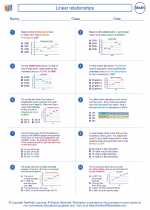
  Worksheet/Answer key
 Linear relationships

 Worksheet/Answer key
 Worksheet/Answer key
 Worksheet/Answer key

The resources above cover the following skills:
Data Analysis and Probability (NCTM)
Develop and evaluate inferences and predictions that are based on data.
Make conjectures about possible relationships between two characteristics of a sample on the basis of scatterplots of the data and approximate lines of fit.
Grade 8 Curriculum Focal Points (NCTM)
Algebra: Analyzing and representing linear functions and solving linear equations and systems of linear equations
Students use linear functions, linear equations, and systems of linear equations to represent, analyze, and solve a variety of problems. They recognize a proportion (y/x = k, or y = kx) as a special case of a linear equation of the form y = mx + b, understanding that the constant of proportionality (k) is the slope and the resulting graph is a line through the origin. Students understand that the slope (m) of a line is a constant rate of change, so if the input, or x-coordinate, changes by a specific amount, a, the output, or y-coordinate, changes by the amount ma. Students translate among verbal, tabular, graphical, and algebraic representations of functions (recognizing that tabular and graphical representations are usually only partial representations), and they describe how such aspects of a function as slope and y-intercept appear in different representations. Students solve systems of two linear equations in two variables and relate the systems to pairs of lines that intersect, are parallel, or are the same line, in the plane. Students use linear equations, systems of linear equations, linear functions, and their understanding of the slope of a line to analyze situations and solve problems.
Connections to the Grade 8 Focal Points (NCTM)
Data Analysis: Building on their work in previous grades to organize and display data to pose and answer questions, students now see numerical data as an aggregate, which they can often summarize with one or several numbers. In addition to the median, students determine the 25th and 75th percentiles (1st and 3rd quartiles) to obtain information about the spread of data. They may use box-and-whisker plots to convey this information. Students make scatterplots to display bivariate data, and they informally estimate lines of best fit to make and test conjectures.