Measures in Mathematics
Measures in mathematics refer to the numerical values used to quantify various attributes or quantities. These measures are used to compare, evaluate, and analyze different mathematical elements. In the context of this study guide, we will explore measures of central tendency, measures of dispersion, and measures of position.
Measures of Central Tendency
Measures of central tendency are statistical measures that represent the center or middle of a set of data. The main measures of central tendency include the mean, median, and mode.
- Mean: The mean is calculated by adding up all the values in a data set and then dividing by the total number of values. It is also known as the average.
- Median: The median is the middle value in a data set when the values are arranged in ascending or descending order. If there are two middle values, the median is the average of those two values.
- Mode: The mode is the value that appears most frequently in a data set. A data set may have one mode, more than one mode, or no mode at all.
Measures of Dispersion
Measures of dispersion are statistical measures that indicate the spread or variability of a set of data. The main measures of dispersion include range, variance, and standard deviation.
- Range: The range is the difference between the highest and lowest values in a data set. It provides a simple measure of the spread of the data.
- Variance: The variance measures how far each number in the set is from the mean. It is calculated by averaging the squared differences from the mean.
- Standard Deviation: The standard deviation is a measure of the amount of variation or dispersion of a set of values. It is the square root of the variance.
Measures of Position
Measures of position are statistical measures that determine the position of a particular value within a data set. The main measures of position include percentiles and quartiles.
- Percentiles: Percentiles divide a set of data into 100 equal parts. For example, the 25th percentile represents the value below which 25% of the data falls.
- Quartiles: Quartiles divide a set of data into four equal parts. The first quartile (Q1) represents the 25th percentile, the second quartile (Q2) represents the median, and the third quartile (Q3) represents the 75th percentile.
Study Guide
When studying measures in mathematics, it is important to understand the concepts and calculations involved in measures of central tendency, measures of dispersion, and measures of position. Here are some key points to focus on when preparing for a test or examination:
- Understand the formulas and methods for calculating the mean, median, mode, range, variance, standard deviation, percentiles, and quartiles.
- Practice solving problems involving measures of central tendency, dispersion, and position to reinforce your understanding of the concepts.
- Learn to interpret and analyze data using measures of central tendency, dispersion, and position to make informed conclusions and decisions.
- Use real-life examples and applications of measures to understand their practical significance and relevance.
By mastering the concepts and applications of measures in mathematics, you will be well-equipped to analyze and interpret data effectively, making informed decisions and drawing meaningful conclusions from numerical information.
[Measures] Related Worksheets and Study Guides:
.◂Math Worksheets and Study Guides Eighth Grade. Polynomials and Exponents
 Worksheet/Answer key
 Worksheet/Answer key
 Worksheet/Answer key
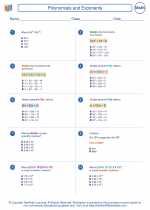
 Worksheet/Answer key
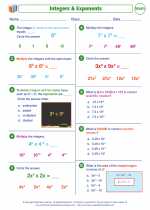
 Worksheet/Answer key
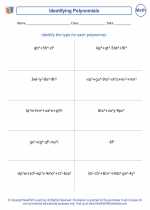
 Worksheet/Answer key