Tables in Math
In mathematics, a table is a way to organize data in rows and columns. Each row represents a different set of data, and each column represents a different variable or category. Tables are commonly used to display and analyze numerical information, making it easier to spot patterns and relationships within the data.
Parts of a Table
Before we dive into understanding and working with tables, it's important to familiarize ourselves with the basic parts of a table:
- Title: The title of the table describes the information being presented.
- Header: The header row contains the column titles, which represent the variables or categories being measured.
- Body: The body of the table contains the actual data organized into rows and columns.
- Row: A horizontal arrangement of data within the table, representing a specific set of information.
- Column: A vertical arrangement of data within the table, representing a specific variable or category.
Types of Tables
There are different types of tables used in mathematics and statistics, including:
- Frequency Table: A table used to show the number of times each item occurs in a data set.
- Two-Way Table: A table used to display the relationship between two categorical variables.
- Multiplication Table: A table used to display the results of multiplying two numbers together, often used for learning multiplication facts.
Working with Tables
When working with tables, it's important to be able to interpret the data they contain. This includes being able to:
- Identify patterns or trends within the data.
- Calculate totals, averages, and other summary statistics based on the data in the table.
- Use the information in the table to make predictions or draw conclusions about the data set.
Study Guide
Here are some key concepts and skills to focus on when studying tables:
- Understanding the parts of a table and how to interpret the information in each part.
- Practice creating and organizing data into tables based on given information or a scenario.
- Practice analyzing tables to identify patterns, calculate totals, and draw conclusions based on the data.
- Work on real-world applications of tables, such as interpreting data from graphs and creating tables to represent real-world scenarios.
By mastering the concepts and skills related to tables, you'll be well-equipped to work with and interpret data effectively in various mathematical and statistical contexts.
.◂Math Worksheets and Study Guides Eighth Grade. Polynomials and Exponents
 Worksheet/Answer key
 Worksheet/Answer key
 Worksheet/Answer key
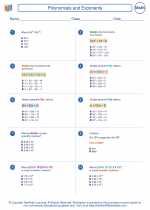
 Worksheet/Answer key
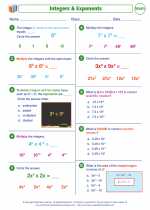
 Worksheet/Answer key
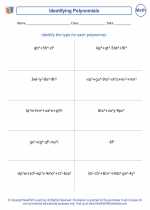
 Worksheet/Answer key