Bar Chart
A bar chart, also known as a bar graph, is a graphical representation of data in which the data is presented using rectangular bars of equal width. The length of each bar is proportional to the value it represents. Bar charts are used to compare different categories of data and to show the relationship between them.
Parts of a Bar Chart
- Title: A descriptive title that explains the content of the bar chart.
- X-axis: The horizontal axis that represents the categories or groups being compared.
- Y-axis: The vertical axis that represents the value or frequency of the categories.
- Bars: Rectangular bars that represent the values of the different categories. The height or length of the bars corresponds to the data being represented.
- Labels: Labels on the axes and bars to provide additional information about the data being displayed.
Types of Bar Charts
There are different types of bar charts, including:
- Vertical Bar Chart: The bars are plotted vertically along the horizontal axis.
- Horizontal Bar Chart: The bars are plotted horizontally along the vertical axis.
- Grouped Bar Chart: Multiple sets of bars are grouped together, allowing for the comparison of data across different groups or categories.
- Stacked Bar Chart: Bars are stacked on top of each other to represent the total and the individual components of the total.
Creating a Bar Chart
To create a bar chart, follow these steps:
- Identify the categories or groups to be represented on the x-axis.
- Determine the values or frequencies to be represented on the y-axis.
- Choose an appropriate scale for the axes to ensure the data is clearly represented.
- Draw the bars for each category, making sure to label the axes and bars appropriately.
- Add a title to the bar chart to provide context for the data being presented.
Interpreting a Bar Chart
When interpreting a bar chart, consider the following:
- Look for patterns or trends in the data.
- Compare the lengths of the bars to identify relationships between the categories.
- Pay attention to the scale of the axes to ensure accurate interpretation of the data.
- Consider the context of the data and what insights can be gained from the bar chart.
Study Guide
Here are some key points to remember about bar charts:
- Bar charts are used to compare different categories of data.
- The length of each bar is proportional to the value it represents.
- Bar charts have a title, x-axis, y-axis, bars, and labels.
- There are different types of bar charts, including vertical, horizontal, grouped, and stacked bar charts.
- When interpreting a bar chart, look for patterns, trends, and relationships between the categories.
Remember to practice creating and interpreting bar charts to strengthen your understanding of this topic.
.◂Math Worksheets and Study Guides Eighth Grade. Real numbers
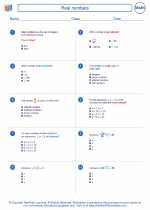
Study Guide Real numbers
  Worksheet/Answer key
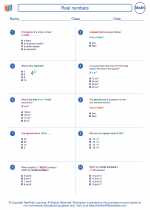
 Real numbers
  Worksheet/Answer key
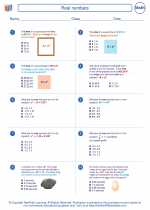
 Real numbers
  Worksheet/Answer key
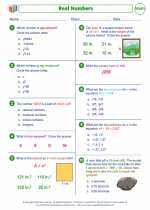
 Real numbers
  Worksheet/Answer key
 Real numbers

 Worksheet/Answer key
 Worksheet/Answer key
 Worksheet/Answer key
 Worksheet/Answer key

The resources above cover the following skills:
The Number System
Know that there are numbers that are not rational, and approximate them by rational numbers.
Know that numbers that are not rational are called irrational. Understand informally that every number has a decimal expansion; for rational numbers show that the decimal expansion repeats eventually, and convert a decimal expansion which repeats eventually into a rational number. [8-NS1]
Expressions and Equations
Work with radicals and integer exponents.
Use square root and cube root symbols to represent solutions to equations of the form x^2 = p and x^3 = p, where p is a positive rational number. Evaluate square roots of small perfect squares and cube roots of small perfect cubes. Know that √2 is irrational. [8-EE2]