Line Chart
A line chart is a type of graph that displays information as a series of data points called 'markers' connected by straight line segments. It is often used to show the trend of a data set over time.
Key Components of a Line Chart:
- X-axis: The horizontal axis that represents the independent variable, such as time or categories.
- Y-axis: The vertical axis that represents the dependent variable, such as numerical values.
- Data Points: Individual values plotted on the chart at specific x and y coordinates.
- Line: The line that connects the data points, showing the trend or pattern of the data.
When to Use a Line Chart:
Line charts are commonly used when you want to visualize the trend of data over time or to show the relationship between two variables. They are effective for displaying continuous data and identifying patterns or trends.
Creating a Line Chart:
- Collect and organize your data, ensuring you have pairs of x and y values.
- Choose the appropriate scale for the x and y axes based on your data range.
- Plot the data points on the chart and connect them with a line to show the trend.
- Add axis labels, a title, and any necessary annotations to make the chart easy to understand.
Example:
Below is an example of a simple line chart showing the monthly sales data for a company over a year:
Study Tips:
To better understand line charts, practice the following:
- Interpreting line charts to identify trends and patterns in data.
- Creating line charts from given sets of data to represent the information visually.
- Using line charts to make predictions or analyze relationships between variables.
Understanding line charts is an important skill in data analysis and visualization. Be sure to practice creating and interpreting line charts to master this concept.
.◂Math Worksheets and Study Guides Eighth Grade. Real numbers
Study Guide Real numbers
  Worksheet/Answer key
 Real numbers
  Worksheet/Answer key
 Real numbers
  Worksheet/Answer key
 Real numbers
  Worksheet/Answer key
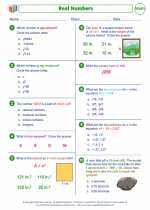 Real numbers

 Worksheet/Answer key
 Worksheet/Answer key
 Worksheet/Answer key
 Worksheet/Answer key

The resources above cover the following skills:
The Number System
Know that there are numbers that are not rational, and approximate them by rational numbers.
Know that numbers that are not rational are called irrational. Understand informally that every number has a decimal expansion; for rational numbers show that the decimal expansion repeats eventually, and convert a decimal expansion which repeats eventually into a rational number. [8-NS1]
Expressions and Equations
Work with radicals and integer exponents.
Use square root and cube root symbols to represent solutions to equations of the form x^2 = p and x^3 = p, where p is a positive rational number. Evaluate square roots of small perfect squares and cube roots of small perfect cubes. Know that √2 is irrational. [8-EE2]