Charts/Maps/Graphic Organizers Study Guide
Charts, maps, and graphic organizers are visual tools that help organize and present information in a clear and easy-to-understand way.
Types of Charts/Maps/Graphic Organizers:
- Charts: Bar charts, line charts, pie charts, and tables are used to display data and compare information.
- Maps: Maps provide visual representations of geographical locations, features, and relationships between places.
- Graphic Organizers: Graphic organizers such as Venn diagrams, flow charts, and concept maps help illustrate relationships, sequences, and hierarchies of information.
Uses of Charts/Maps/Graphic Organizers:
- Charts help to compare and contrast data, track changes over time, and illustrate percentages.
- Maps are used to show geographical information, such as landforms, countries, and cities.
- Graphic organizers aid in organizing thoughts, brainstorming ideas, and understanding complex concepts.
Study Tips:
- When using charts, pay attention to the labels, axes, and legends to understand the data being presented.
- For maps, focus on understanding the key, scale, and legends to interpret the information accurately.
- When creating graphic organizers, start by identifying the main ideas and then add supporting details to build a clear structure.
Examples:
Here are some examples of how charts, maps, and graphic organizers can be used:
- A bar chart comparing the sales of different products over a year.
- A map showing the population distribution in a country.
- A Venn diagram comparing and contrasting two literary works.
By using charts, maps, and graphic organizers, it becomes easier to understand and present information in a visually engaging way.
[Charts/Maps/Graphic Organizers] Related Worksheets and Study Guides:
.◂English Language Arts Worksheets and Study Guides Third Grade. Charts/Maps/Graphic Organizers
Study Guide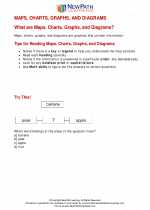 Charts/Maps/Graphic Organizers
  Worksheet/Answer key
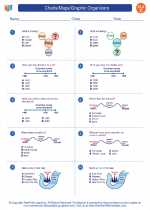 Charts/Maps/Graphic Organizers
  Worksheet/Answer key
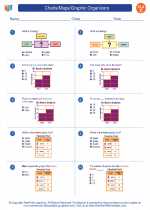 Charts/Maps/Graphic Organizers
  Worksheet/Answer key
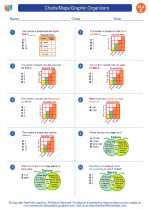 Charts/Maps/Graphic Organizers
  Worksheet/Answer key
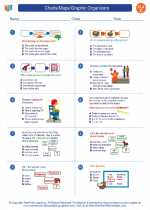 Charts/Maps/Graphic Organizers
  Worksheet/Answer key
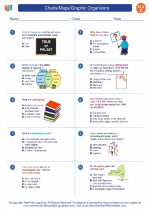 Charts/Maps/Graphic Organizers
  Worksheet/Answer key
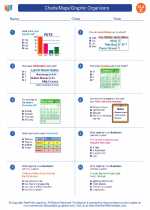 Charts/Maps/Graphic Organizers

 Worksheet/Answer key
 Worksheet/Answer key
 Worksheet/Answer key
 Worksheet/Answer key
 Worksheet/Answer key
 Worksheet/Answer key

The resources above cover the following skills:
Reading Standards for Informational Text
Integration of Knowledge and Ideas
Use information gained from illustrations (e.g., maps, photographs) and the words in a text to demonstrate understanding of the text (e.g., where, when, why, and how key events occur). [RI.3.7]