Understanding the Parts of a Bar Chart:
- X-axis: The horizontal axis of the chart that represents the categories or groups being compared.
- Y-axis: The vertical axis of the chart that represents the values or frequencies of the categories.
- Bars: The rectangular bars that represent the values of each category.
Creating a Bar Chart:
To create a bar chart:
- Identify the categories or groups you want to compare.
- Determine the values or frequencies for each category.
- Draw a horizontal axis and a vertical axis, labeling them appropriately.
- Draw a bar for each category, making sure the length of the bar corresponds to the value it represents.
Interpreting a Bar Chart:
When interpreting a bar chart:
- Compare the lengths of the bars to understand which category has the highest or lowest value.
- Look for patterns or trends among the categories.
- Use the chart to make conclusions or predictions based on the data.
[Bar Chart] Related Worksheets and Study Guides:
.◂Math Worksheets and Study Guides Third Grade. Counting Money
Study Guide Counting Money
  Activity Lesson
 Counting Coins
  Activity Lesson
 School Sports
  Activity Lesson
 Package Pile-Up
  Worksheet/Answer key
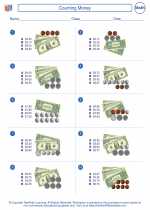 Counting Money
  Worksheet/Answer key
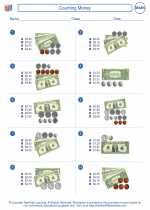 Counting Money
  Worksheet/Answer key
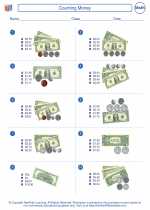 Counting Money
  Worksheet/Answer key
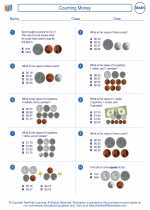 Counting Money
  Worksheet/Answer key
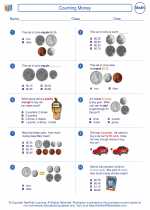 Counting Money
  Worksheet/Answer key
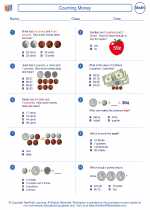 Counting Money
  Worksheet/Answer key
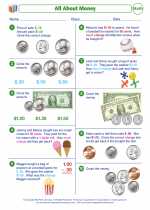 All About Money
  Worksheet/Answer key
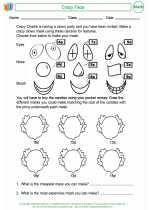 Crazy Face
  Worksheet/Answer key
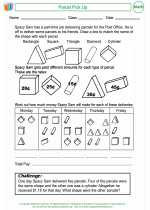 Parcel Pick Up
  Worksheet/Answer key
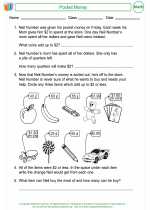 Pocket Money

 Activity Lesson
 Activity Lesson
 Activity Lesson
 Worksheet/Answer key
 Worksheet/Answer key
 Worksheet/Answer key
 Worksheet/Answer key
 Worksheet/Answer key
 Worksheet/Answer key
 Worksheet/Answer key
 Worksheet/Answer key
 Worksheet/Answer key
 Worksheet/Answer key

Create And Print more Counting Money worksheets with Money Skills Worksheets generator
The resources above cover the following skills:
Algebra (NCTM)
Use mathematical models to represent and understand quantitative relationships.
Model problem situations with objects and use representations such as graphs, tables, and equations to draw conclusions.