Graphs and Charts
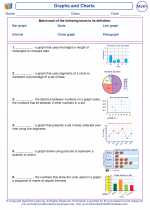
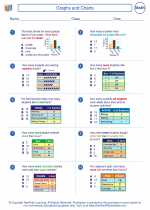
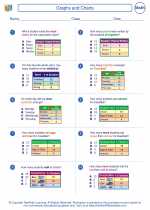
Graphs and charts are visual representations of data. They are used to organize and present information in a way that is easy to understand and interpret. There are several types of graphs and charts, each suited for different types of data and purposes.
Types of Graphs and Charts
Some common types of graphs and charts include:
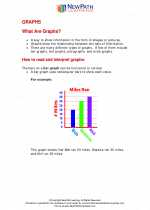
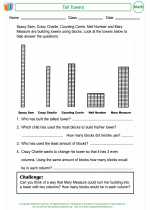
- Bar Graphs: These are used to compare different categories of data. The height or length of the bars represents the value of each category.
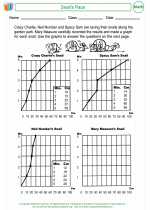
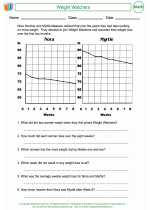
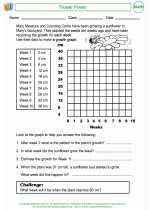
- Line Graphs: These are used to show trends or changes over time. They are often used to track changes in data over a period of time.
- Pie Charts: These are used to show the parts of a whole. The entire pie represents 100% of the data, and each slice represents a proportion of that total.
- Scatter Plots: These are used to show the relationship between two sets of data. Each point on the plot represents a pairing of the two variables.
- Histograms: These are similar to bar graphs, but are used for displaying the distribution of continuous data.
Interpreting Graphs and Charts
When interpreting graphs and charts, it's important to pay attention to the axes, labels, and scales. These elements provide crucial information about the data being presented. It's also important to look for trends, patterns, and outliers in the data, and to consider the context in which the data was collected.
Creating Graphs and Charts
There are many tools available for creating graphs and charts, including graphing calculators, spreadsheet software, and online graphing tools. When creating a graph or chart, it's important to choose the right type for the data being presented, and to ensure that the visual design is clear and easy to understand.
.◂Math Worksheets and Study Guides Third Grade. Graphs and Charts
 Activity Lesson
 Activity Lesson
 Activity Lesson
 Worksheet/Answer key
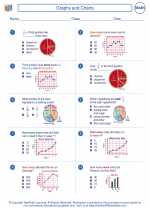
 Worksheet/Answer key
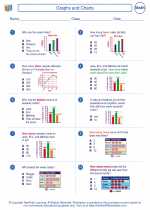
 Worksheet/Answer key
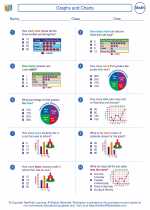
 Worksheet/Answer key
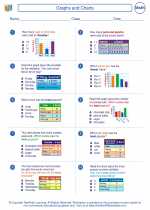
 Worksheet/Answer key
 Worksheet/Answer key
 Worksheet/Answer key
 Worksheet/Answer key
 Worksheet/Answer key
 Worksheet/Answer key
 Vocabulary/Answer key