Line Chart
A line chart is a type of graph that displays information as a series of data points, called 'markers,' connected by straight line segments. It is commonly used to show trends and relationships over time.
Key Elements of a Line Chart
- X-axis: The horizontal axis that represents the independent variable, such as time, categories, or other ordered data.
- Y-axis: The vertical axis that represents the dependent variable, such as numerical values or counts.
- Data Points: Individual points on the chart that represent specific values of the variables being measured.
- Line: The line that connects the data points, showing the trend or pattern in the data.
- Title and Labels: The chart should have a title and labels for the x-axis and y-axis to provide context and clarity.
How to Create a Line Chart
- Collect Data: Gather the data points that you want to represent on the chart.
- Choose the Variables: Determine which variable will be represented on the x-axis and which will be on the y-axis.
- Scale the Axes: Determine the range and scale for each axis to best display the data.
- Plot the Points: Plot each data point on the chart using the appropriate coordinates.
- Connect the Points: Draw a line that connects the data points, showing the trend or pattern in the data.
- Add Titles and Labels: Include a title and labels for the axes to provide context for the chart.
Study Guide
To understand line charts better, consider the following study guide:
- What are the key elements of a line chart?
- How are line charts different from bar charts and pie charts?
- When is it appropriate to use a line chart to represent data?
- Explain the process of creating a line chart using a specific example.
- What are some best practices for labeling and titling a line chart?
- Provide examples of real-world situations where line charts are commonly used.
Understanding line charts is an essential skill for interpreting and communicating data in various fields, including business, science, and social studies.
.◂Math Worksheets and Study Guides Third Grade. Counting Money
Study Guide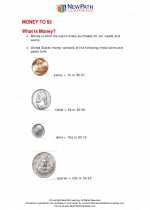 Counting Money
  Activity Lesson
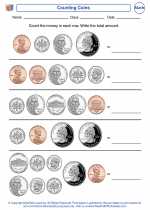 Counting Coins
  Activity Lesson
 School Sports
  Activity Lesson
 Package Pile-Up
  Worksheet/Answer key
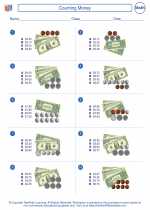 Counting Money
  Worksheet/Answer key
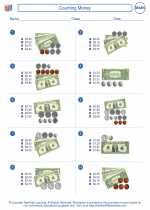 Counting Money
  Worksheet/Answer key
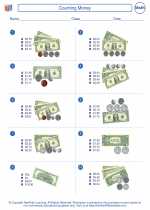 Counting Money
  Worksheet/Answer key
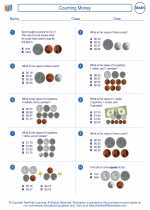 Counting Money
  Worksheet/Answer key
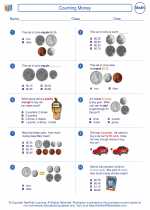 Counting Money
  Worksheet/Answer key
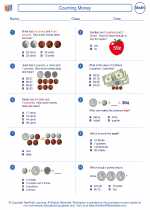 Counting Money
  Worksheet/Answer key
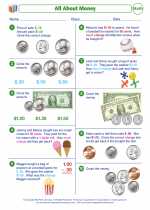 All About Money
  Worksheet/Answer key
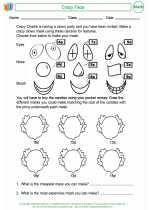 Crazy Face
  Worksheet/Answer key
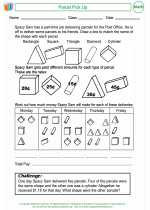 Parcel Pick Up
  Worksheet/Answer key
 Pocket Money

 Activity Lesson
 Activity Lesson
 Activity Lesson
 Worksheet/Answer key
 Worksheet/Answer key
 Worksheet/Answer key
 Worksheet/Answer key
 Worksheet/Answer key
 Worksheet/Answer key
 Worksheet/Answer key
 Worksheet/Answer key
 Worksheet/Answer key
 Worksheet/Answer key

Create And Print more Counting Money worksheets with Money Skills Worksheets generator
The resources above cover the following skills:
Algebra (NCTM)
Use mathematical models to represent and understand quantitative relationships.
Model problem situations with objects and use representations such as graphs, tables, and equations to draw conclusions.