Line Graphs
A line graph is a type of chart used to display data points over time or other continuous intervals. It is particularly useful for showing trends and changes in data over time. Line graphs are made up of points that are connected by straight lines. Each point represents a data value, and the lines show the relationship between the data points.
Components of a Line Graph
- X-axis: The horizontal axis that represents the independent variable (e.g., time, categories).
- Y-axis: The vertical axis that represents the dependent variable (e.g., quantity, measurements).
- Data Points: The individual values plotted on the graph.
- Lines: The lines that connect the data points to show the trend or pattern in the data.
- Title: A descriptive title that summarizes the data being displayed on the graph.
Creating a Line Graph
To create a line graph, follow these steps:
- Collect your data and organize it into two columns: one for the independent variable (X-axis) and one for the dependent variable (Y-axis).
- Choose a scale for the axes that allows all data points to fit on the graph without overcrowding.
- Plot the data points on the graph, with the independent variable values on the X-axis and the dependent variable values on the Y-axis.
- Connect the data points with straight lines to show the trend or pattern in the data.
- Add a title and label the axes with appropriate units of measurement.
Interpreting a Line Graph
When interpreting a line graph, pay attention to the following:
- The direction of the trend (e.g., increasing, decreasing, fluctuating).
- The steepness of the lines, which indicates the rate of change in the data.
- Any significant peaks or troughs in the data.
- Whether there are any patterns or relationships between the data points.
Study Guide
Here are some key points to remember when studying line graphs:
- Understand the purpose of a line graph and when it is most appropriate to use.
- Be familiar with the components of a line graph, including the axes, data points, lines, and title.
- Practice creating line graphs from given data sets.
- Interpret various line graphs to identify trends, patterns, and relationships in the data.
- Pay attention to the units of measurement on the axes and how they affect the interpretation of the graph.
By understanding the principles of line graphs and practicing with different examples, you will become proficient in using and interpreting this type of graph.
.◂Math Worksheets and Study Guides Fourth Grade. Measurement
Study Guide Measurement
  Activity Lesson
 Comparing Volume Capacities
  Activity Lesson
 Measurement Conversion Cards
  Activity Lesson
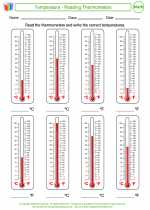 Temperature - Reading Thermometers
  Worksheet/Answer key
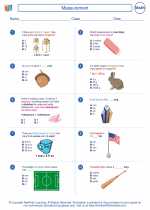 Measurement
  Worksheet/Answer key
 Measurement
  Worksheet/Answer key
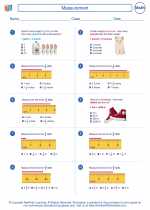 Measurement
  Worksheet/Answer key
 Measurement
  Worksheet/Answer key
 Measurement
  Worksheet/Answer key
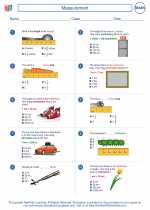 Measurement
  Worksheet/Answer key
 Units of Measurement
  Worksheet/Answer key
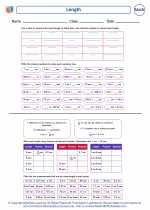 Length
  Worksheet/Answer key
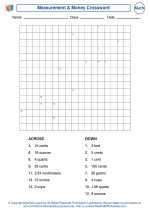 Measurement & Money Crossword
  Worksheet/Answer key
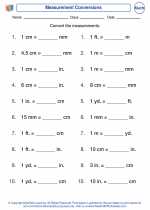 Measurement Conversions
  Vocabulary/Answer key
 Measurement
  Vocabulary/Answer key
 Measurement
  Vocabulary/Answer key
 Measurement

 Activity Lesson
 Activity Lesson
 Activity Lesson
 Worksheet/Answer key
 Worksheet/Answer key
 Worksheet/Answer key
 Worksheet/Answer key
 Worksheet/Answer key
 Worksheet/Answer key
 Worksheet/Answer key
 Worksheet/Answer key
 Worksheet/Answer key
 Worksheet/Answer key
 Vocabulary/Answer key
 Vocabulary/Answer key
 Vocabulary/Answer key

The resources above cover the following skills:
Measurement (NCTM)
Understand measurable attributes of objects and the units, systems, and processes of measurement.
Understand such attributes as length, area, weight, volume, and size of angle and select the appropriate type of unit for measuring each attribute.
Understand the need for measuring with standard units and become familiar with standard units in the customary and metric systems.
Understand that measurements are approximations and how differences in units affect precision.
Apply appropriate techniques, tools, and formulas to determine measurements.
Select and apply appropriate standard units and tools to measure length, area, volume, weight, time, temperature, and the size of angles.