Graphs
A graph is a mathematical representation of data using visual elements like lines, bars, or points. It is used to show the relationship between different sets of data. Graphs are commonly used in mathematics, science, and economics to help interpret and analyze data.
Types of Graphs
There are several types of graphs, each with its own unique features and uses:
- Bar Graph: A bar graph uses rectangular bars to represent and compare data categories. It is useful for comparing data across different categories.
- Line Graph: A line graph uses lines to connect data points, showing how one variable changes in relation to another. It is often used to track changes over time.
- Pie Chart: A pie chart is a circular graph divided into sectors, each representing a proportion of the whole. It is used to show how parts of a whole relate to the entire data set.
- Scatter Plot: A scatter plot uses individual data points to show the relationship between two variables. It is useful for identifying patterns and correlations in the data.
- Histogram: A histogram is similar to a bar graph, but it displays data in intervals or ranges. It is commonly used to represent the distribution of numerical data.
Key Concepts
When working with graphs, there are several key concepts to understand:
- Variables: Graphs typically involve two types of variables - independent variables (often shown on the x-axis) and dependent variables (often shown on the y-axis).
- Scale: The scale of a graph refers to the range of values represented on each axis. It is important to choose an appropriate scale to accurately represent the data.
- Title and Labels: A graph should always have a clear title and labeled axes to provide context and understanding of the data being presented.
- Trends and Patterns: Analyzing the trends and patterns in a graph can provide valuable insights into the relationship between variables and the underlying data.
Study Guide
Here are some key points to focus on when studying graphs:
- Understand the different types of graphs and their specific uses.
- Practice creating and interpreting graphs based on given data sets.
- Learn to identify trends, patterns, and outliers in graphs.
- Master the skills of labeling axes, choosing appropriate scales, and providing clear titles for graphs.
- Explore real-world examples of how graphs are used in various fields such as science, economics, and social studies.
By mastering the concepts and skills related to graphs, you will develop a strong foundation for interpreting and presenting data in a visual and meaningful way.
[Graphs] Related Worksheets and Study Guides:
.◂Math Worksheets and Study Guides Fifth Grade. Adding Fractions
Study Guide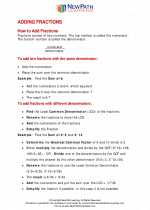 Adding Fractions
  Worksheet/Answer key
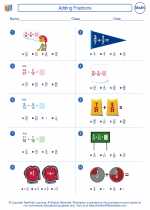 Adding Fractions Worksheet/Answer key
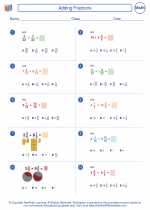 Adding Fractions Worksheet/Answer key
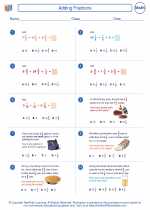 Adding Fractions
Worksheet/Answer keyWorksheet/Answer keyWorksheet/Answer keyCreate And Print more Fractions worksheets with Comparing Fractions, Equivalent Fractions, and Simplifying Fractions
The resources above cover the following skills:
Number and Operations (NCTM)
Understand numbers, ways of representing numbers, relationships among numbers, and number systems.
Develop understanding of fractions as parts of unit wholes, as parts of a collection, as locations on number lines, and as divisions of whole numbers.
Compute fluently and make reasonable estimates.
Use visual models, benchmarks, and equivalent forms to add and subtract commonly used fractions and decimals.
Algebra (NCTM)
Use mathematical models to represent and understand quantitative relationships.
Model problem situations with objects and use representations such as graphs, tables, and equations to draw conclusions.
Connections to the Grade 5 Focal Points (NCTM)
Algebra: Students use patterns, models, and relationships as contexts for writing and solving simple equations and inequalities. They create graphs of simple equations. They explore prime and composite numbers and discover concepts related to the addition and subtraction of fractions as they use factors and multiples, including applications of common factors and common multiples. They develop an understanding of the order of operations and use it for all operations.