Topic: Analyzing, Graphing and Displaying Data
Introduction
When working with data, it is important to be able to analyze and display it effectively. This involves understanding different types of graphs, measures of central tendency, and measures of spread. In this topic, we will explore various methods for analyzing, graphing, and displaying data.
Key Concepts
- Types of Graphs: Bar graphs, line graphs, pie charts, and histograms are common ways to visually represent data.
- Measures of Central Tendency: Mean, median, and mode are used to describe the center of a set of data.
- Measures of Spread: Range, variance, and standard deviation help to quantify the spread or variability of data.
- Interpreting Data: Understanding how to interpret different types of graphs and summary statistics is crucial for drawing meaningful conclusions from data.
Study Guide
Here are the key steps and strategies to master the topic of analyzing, graphing, and displaying data:
- Understanding Data Types: Begin by understanding the different types of data (e.g., categorical, numerical) and the appropriate ways to display each type.
- Choosing the Right Graph: Learn when to use bar graphs, line graphs, pie charts, and histograms based on the nature of the data being presented.
- Calculating Measures of Central Tendency: Practice finding the mean, median, and mode for different sets of data and understanding their significance.
- Exploring Measures of Spread: Work on calculating the range, variance, and standard deviation to understand the variability within a data set.
- Interpreting Graphs and Statistics: Practice interpreting graphs and summary statistics to draw conclusions and make comparisons.
- Real-World Applications: Explore real-world scenarios where data analysis and graphical representation are used, such as in scientific research, business, or social studies.
Practice Problems
Here are some sample problems to reinforce your understanding:
- Create a bar graph to represent the sales of different products in a store over a month.
- Calculate the mean, median, and mode for the following data set: 12, 15, 18, 20, 22, 25, 30.
- Draw a histogram to display the distribution of test scores in a class.
- Compare the variance and standard deviation for two sets of data to understand their variability.
Conclusion
Mastering the skills of analyzing, graphing, and displaying data is essential for making sense of the world around us. By understanding the key concepts and practicing with real-world examples, you can become proficient in effectively presenting and interpreting data.
.◂Math Worksheets and Study Guides Seventh Grade. Analyzing, Graphing and Displaying Data
Study Guide Analyzing, Graphing and Displaying Data
  Worksheet/Answer key
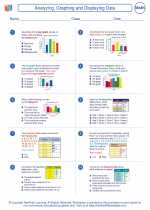 Analyzing, Graphing and Displaying Data
  Worksheet/Answer key
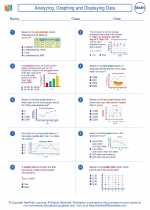 Analyzing, Graphing and Displaying Data
  Worksheet/Answer key
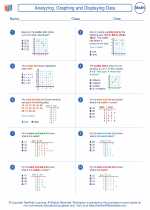 Analyzing, Graphing and Displaying Data
  Worksheet/Answer key
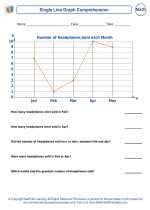 Single Line Graph Comprehension
  Worksheet/Answer key
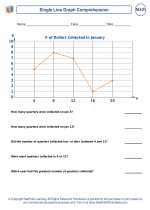 Single Line Graph Comprehension
  Worksheet/Answer key
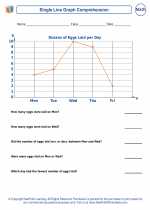 Single Line Graph Comprehension

 Worksheet/Answer key
 Worksheet/Answer key
 Worksheet/Answer key
 Worksheet/Answer key
 Worksheet/Answer key
 Worksheet/Answer key

The resources above cover the following skills:
Data Analysis and Probability (NCTM)
Formulate questions that can be addressed with data and collect, organize, and display relevant data to answer them.
Select, create, and use appropriate graphical representations of data, including histograms, box plots, and scatterplots.
Select and use appropriate statistical methods to analyze data.
Discuss and understand the correspondence between data sets and their graphical representations, especially histograms, stem-and-leaf plots, box plots, and scatterplots.
Develop and evaluate inferences and predictions that are based on data.
Make conjectures about possible relationships between two characteristics of a sample on the basis of scatterplots of the data and approximate lines of fit.
Connections to the Grade 7 Focal Points (NCTM)
Data Analysis: Students use proportions to make estimates relating to a population on the basis of a sample. They apply percentages to make and interpret histograms and circle graphs.