Parallel Lines
When two lines are parallel, it means they will never intersect, no matter how far they are extended in either direction. In other words, they always maintain the same distance apart and will never cross each other.
Properties of Parallel Lines:
- Equal Corresponding Angles: When a transversal crosses two parallel lines, the corresponding angles are equal.
- Alternate Interior Angles: When a transversal crosses two parallel lines, the alternate interior angles are equal.
- Co-interior Angles: When a transversal crosses two parallel lines, the co-interior angles are supplementary, meaning they add up to 180 degrees.
- Parallel Line Theorem: If two parallel lines are cut by a transversal, the interior same-side angles are supplementary.
Study Guide:
To understand parallel lines better, make sure to:
- Memorize the properties of parallel lines, including corresponding angles, alternate interior angles, and co-interior angles.
- Practice identifying and solving problems involving parallel lines and transversals.
- Understand the concept of slope and how it relates to parallel lines (parallel lines have the same slope).
- Use visual aids such as diagrams and graphs to better comprehend the concept of parallel lines.
Remember to always practice with different examples to strengthen your understanding of parallel lines.
.◂Math Worksheets and Study Guides Seventh Grade. Analyzing, Graphing and Displaying Data
Study Guide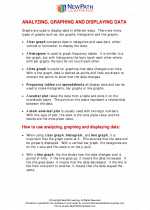 Analyzing, Graphing and Displaying Data
  Worksheet/Answer key
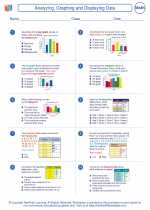 Analyzing, Graphing and Displaying Data
  Worksheet/Answer key
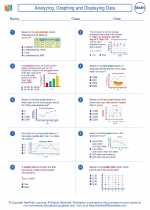 Analyzing, Graphing and Displaying Data
  Worksheet/Answer key
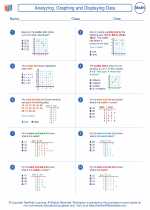 Analyzing, Graphing and Displaying Data
  Worksheet/Answer key
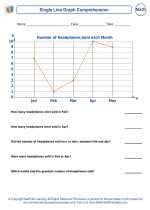 Single Line Graph Comprehension
  Worksheet/Answer key
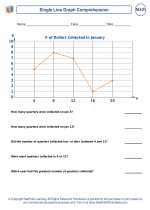 Single Line Graph Comprehension
  Worksheet/Answer key
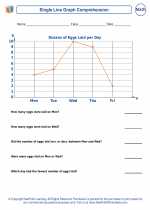 Single Line Graph Comprehension

 Worksheet/Answer key
 Worksheet/Answer key
 Worksheet/Answer key
 Worksheet/Answer key
 Worksheet/Answer key
 Worksheet/Answer key

The resources above cover the following skills:
Data Analysis and Probability (NCTM)
Formulate questions that can be addressed with data and collect, organize, and display relevant data to answer them.
Select, create, and use appropriate graphical representations of data, including histograms, box plots, and scatterplots.
Select and use appropriate statistical methods to analyze data.
Discuss and understand the correspondence between data sets and their graphical representations, especially histograms, stem-and-leaf plots, box plots, and scatterplots.
Develop and evaluate inferences and predictions that are based on data.
Make conjectures about possible relationships between two characteristics of a sample on the basis of scatterplots of the data and approximate lines of fit.
Connections to the Grade 7 Focal Points (NCTM)
Data Analysis: Students use proportions to make estimates relating to a population on the basis of a sample. They apply percentages to make and interpret histograms and circle graphs.