Equations and Inequalities -> graphing
Graphing
What is graphing?
Graphing is the process of representing data or functions visually using graphs or charts. In mathematics, graphing is often used to show the relationship between two variables or to represent functions.
Types of Graphs
There are several types of graphs commonly used in mathematics:
- Line Graphs: Used to show the relationship between two variables by connecting data points with straight lines.
- Bar Graphs: Used to compare different categories of data by using rectangular bars of varying lengths.
- Pie Charts: Used to show the parts of a whole by dividing a circle into sectors.
- Scatter Plots: Used to display the relationship between two sets of data by plotting points on a coordinate plane.
Graphing Linear Equations
When graphing linear equations, the standard form y = mx + b is often used. Here, m represents the slope of the line, and b represents the y-intercept.
To graph a linear equation, follow these steps:
- Identify the y-intercept (b) and plot the point (0, b).
- Use the slope (m) to find another point on the line. For example, if the slope is 2, move up 2 units and right 1 unit from the y-intercept and plot another point.
- Draw a straight line through the two points to represent the graph of the linear equation.
Study Guide for Graphing
To effectively study graphing, consider the following tips:
- Understand the different types of graphs and when each type is used.
- Practice plotting points on a coordinate plane to become familiar with graphing linear equations.
- Learn how to calculate and interpret the slope of a line.
- Review how to find and plot the y-intercept of a linear equation.
- Work on interpreting graphs and extracting information from them.
By mastering the concepts and skills related to graphing, you'll be able to effectively represent data and functions visually, helping you solve mathematical problems more easily.
.◂Math Worksheets and Study Guides Seventh Grade. Equations and Inequalities
Study Guide Equations and Inequalities
  Worksheet/Answer key
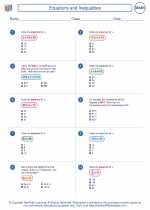 Equations and Inequalities
  Worksheet/Answer key
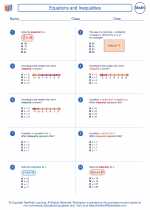 Equations and Inequalities
  Worksheet/Answer key
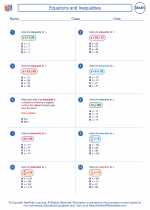 Equations and Inequalities
  Worksheet/Answer key
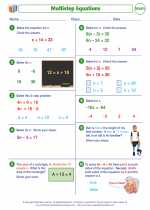 Multistep Equations
  Worksheet/Answer key
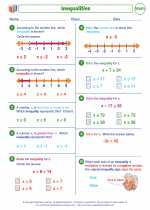 Inequalities
  Worksheet/Answer key
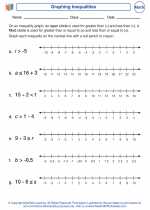 Graphing Inequalities

 Worksheet/Answer key
 Worksheet/Answer key
 Worksheet/Answer key
 Worksheet/Answer key
 Worksheet/Answer key
 Worksheet/Answer key

The resources above cover the following skills:
Algebra (NCTM)
Represent and analyze mathematical situations and structures using algebraic symbols.
Use symbolic algebra to represent situations and to solve problems, especially those that involve linear relationships.
Recognize and generate equivalent forms for simple algebraic expressions and solve linear equations
Grade 7 Curriculum Focal Points (NCTM)
Number and Operations and Algebra: Developing an understanding of operations on all rational numbers and solving linear equations
Students extend understandings of addition, subtraction, multiplication, and division, together with their properties, to all rational numbers, including negative integers. By applying properties of arithmetic and considering negative numbers in everyday contexts (e.g., situations of owing money or measuring elevations above and below sea level), students explain why the rules for adding, subtracting, multiplying, and dividing with negative numbers make sense. They use the arithmetic of rational numbers as they formulate and solve linear equations in one variable and use these equations to solve problems. Students make strategic choices of procedures to solve linear equations in one variable and implement them efficiently, understanding that when they use the properties of equality to express an equation in a new way, solutions that they obtain for the new equation also solve the original equation.