Histogram
A histogram is a graphical representation of the distribution of numerical data. It consists of a series of vertical bars, where each bar represents a range of values, and the height of the bar corresponds to the frequency of values within that range.
Key Concepts
- Frequency: The number of data points that fall within a specific range or bin.
- Bins: The intervals into which the data is grouped for display on the histogram.
- X-axis: Represents the range of values or bins.
- Y-axis: Represents the frequency of values within each bin.
Creating a Histogram
To create a histogram, follow these steps:
- Determine the range of the data and decide on the number of bins.
- Create the intervals (bins) to group the data.
- Tally the frequency of data points within each bin.
- Draw the X-axis and Y-axis, labeling the bins and frequencies.
- Draw a bar for each bin, with the height of the bar corresponding to the frequency of values in that bin.
Example
Suppose we have the following data representing the scores of a class:
| Score Range | Frequency |
|---|---|
| 70-79 | 5 |
| 80-89 | 8 |
| 90-99 | 3 |
Study Guide
Key points to remember about histograms:
- Understand the concept of frequency and how it is represented in a histogram.
- Know how to create intervals (bins) and tally the frequencies for each bin.
- Be able to interpret a histogram and draw conclusions about the data distribution.
◂Math Worksheets and Study Guides Seventh Grade. Finding Volume
Study Guide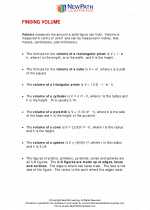 Finding Volume
  Activity Lesson
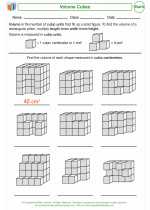 Volume Cubes Activity Lesson
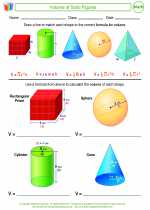 Volume of Solid Figures Activity Lesson
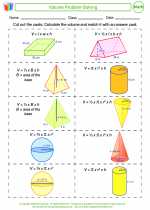 Volume Problem Worksheet/Answer key
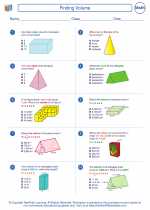 Finding Volume Worksheet/Answer key
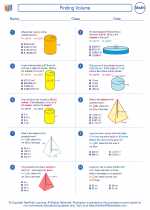 Finding Volume Worksheet/Answer key
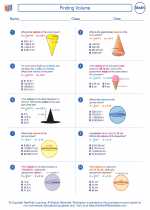 Finding Volume Worksheet/Answer key
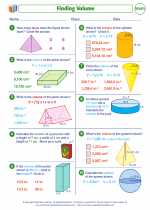 Finding Volume
Activity LessonActivity LessonActivity LessonWorksheet/Answer keyWorksheet/Answer keyWorksheet/Answer keyWorksheet/Answer keyThe resources above cover the following skills:
Geometry (NCTM)
Analyze characteristics and properties of two- and three-dimensional geometric shapes and develop mathematical arguments about geometric relationships.
Precisely describe, classify, and understand relationships among types of two- and three-dimensional objects using their defining properties.
Use visualization, spatial reasoning, and geometric modeling to solve problems.
Use geometric models to represent and explain numerical and algebraic relationships.
Measurement (NCTM)
Apply appropriate techniques, tools, and formulas to determine measurements.
Select and apply techniques and tools to accurately find length, area, volume, and angle measures to appropriate levels of precision.
Develop strategies to determine the surface area and volume of selected prisms, pyramids, and cylinders.