Diagrams
What are Diagrams?
Diagrams are visual representations of information or data. They are used to organize, understand, and present information in a visual format. Diagrams can be used in various subjects, including math, science, and technology, to illustrate concepts, processes, and relationships.
Types of Diagrams
There are various types of diagrams, each serving different purposes:
- Flowcharts: These diagrams depict the steps in a process or workflow, often using shapes and arrows to show the flow of information or materials.
- Bar Graphs and Histograms: These diagrams are used to compare different categories of data using bars of varying heights.
- Line Graphs: These diagrams show the relationship between two variables, typically representing one variable on the x-axis and the other on the y-axis.
- Pie Charts: These circular diagrams are used to represent parts of a whole, with each "slice" of the pie representing a percentage of the total.
- Venn Diagrams: These diagrams use overlapping circles to show relationships between different sets or groups.
- Network Diagrams: These diagrams illustrate the connections and interactions between various elements in a system, such as computer networks or project management tasks.
How to Use Diagrams
To effectively use diagrams, consider the following tips:
- Choose the most appropriate type of diagram for the information you want to convey.
- Use clear and concise labels and titles to help the reader understand the content of the diagram.
- Ensure that the scale and proportions of the diagram accurately represent the data being presented.
- Use colors, patterns, or shapes to differentiate and emphasize different elements within the diagram.
- Provide a key or legend if the diagram includes complex or varied elements.
Benefits of Diagrams
Diagrams offer several benefits, including:
- Visual representation of complex information for easier understanding.
- Facilitation of comparisons and analysis of data.
- Enhancement of presentations and reports by adding visual appeal.
- Clarification of relationships and connections between different elements.
Study Guide
When studying diagrams, consider the following:
- Understand the purpose and type of each diagram.
- Practice interpreting and creating different types of diagrams.
- Learn to identify the key elements and components within a diagram.
- Explore real-life examples where diagrams are used to represent information or processes.
- Use diagrams to solve problems and analyze data in various subjects.
Understanding and utilizing diagrams is an essential skill that can greatly enhance your ability to comprehend and communicate information effectively.
.◂Math Worksheets and Study Guides Seventh Grade. Introduction to Functions
Study Guide Introduction to Functions
  Activity Lesson
 Functions Box
  Worksheet/Answer key
 Introduction to Functions
  Worksheet/Answer key
 Introduction to Functions
  Worksheet/Answer key
 Introduction to Functions
  Worksheet/Answer key
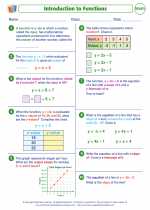 Introduction to Functions
  Worksheet/Answer key
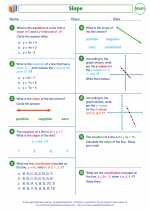 Slope
Slope  Worksheet/Answer key
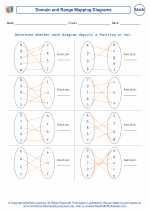 Function or not?
  Worksheet/Answer key
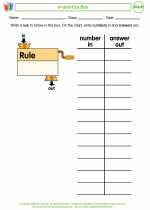 In-and-Out Box

 Activity Lesson
 Worksheet/Answer key
 Worksheet/Answer key
 Worksheet/Answer key
 Worksheet/Answer key
 Worksheet/Answer key
 Worksheet/Answer key
 Worksheet/Answer key

The resources above cover the following skills:
Algebra (NCTM)
Understand patterns, relations, and functions.
Represent, analyze, and generalize a variety of patterns with tables, graphs, words, and, when possible, symbolic rules.
Represent and analyze mathematical situations and structures using algebraic symbols.
Explore relationships between symbolic expressions and graphs of lines, paying particular attention to the meaning of intercept and slope.