Graphs
A graph in mathematics is a visual representation of data, showing the relationship between different variables. Graphs are used to represent and analyze mathematical functions, equations, and real-life phenomena.
Types of Graphs
There are several types of graphs commonly used in mathematics:
- Line Graphs: Line graphs are used to show the relationship between two variables. They are often used to track changes over time.
- Bar Graphs: Bar graphs represent data using rectangular bars of different heights or lengths. They are useful for comparing quantities across different categories.
- Pie Charts: Pie charts are circular graphs divided into sectors to illustrate numerical proportions. They are commonly used to show percentages or parts of a whole.
- Scatter Plots: Scatter plots display individual data points on a two-dimensional graph to show the relationship between two variables.
- Function Graphs: Function graphs represent the relationship between input and output values of a mathematical function.
Key Concepts
When studying graphs, it's important to understand the following key concepts:
- Axis: The horizontal and vertical lines on a graph that intersect at the origin. The horizontal line is the x-axis, and the vertical line is the y-axis.
- Coordinates: Points on a graph are identified by their coordinates, written as (x, y), where x is the value on the x-axis and y is the value on the y-axis.
- Slope: The slope of a line on a graph represents the rate of change between the variables. It is calculated as the change in y divided by the change in x.
- Intercepts: The x-intercept is the point where the graph crosses the x-axis, and the y-intercept is the point where the graph crosses the y-axis.
- Plotting Data: When creating a graph, it's important to accurately plot the data points and connect them appropriately to represent the relationship between the variables.
Study Guide
To effectively study graphs, consider the following steps:
- Review the different types of graphs and their specific uses.
- Practice identifying and interpreting the key elements of a graph, such as the axis, coordinates, slope, and intercepts.
- Work on plotting data points accurately and drawing the appropriate graph based on given information.
- Explore real-life examples where graphs are used to represent and analyze data, such as population trends, economic indicators, and scientific experiments.
- Utilize graphing tools and software to create and analyze graphs, and understand how to input data and customize the appearance of graphs.
By mastering the concepts and practices related to graphs, you will be able to effectively interpret and utilize graphical representations in various mathematical and real-world contexts.
[Graphs] Related Worksheets and Study Guides:
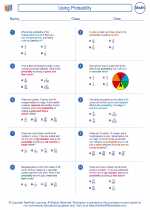
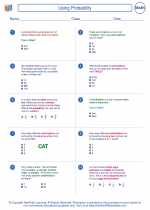
.◂Math Worksheets and Study Guides Seventh Grade. Using Probability
Study Guide Using Probability
  Worksheet/Answer key
 Using Probability
  Worksheet/Answer key
 Using Probability
  Worksheet/Answer key
 Using Probability

 Worksheet/Answer key
 Worksheet/Answer key
 Worksheet/Answer key

The resources above cover the following skills:
Data Analysis and Probability (NCTM)
Understand and apply basic concepts of probability
Compute probabilities for simple compound events, using such methods as organized lists, tree diagrams, and area models.