Analyze the Data - Study Guide
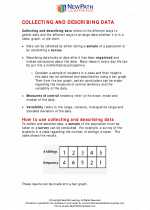
In mathematics, analyzing data involves examining, organizing, interpreting, and making sense of numerical information in order to draw conclusions and make informed decisions. This process often involves using various statistical measures, graphs, and charts to summarize and describe the data.
Key Concepts
- Data Types: Understand the different types of data, including categorical (qualitative) and numerical (quantitative) data.
- Measures of Central Tendency: Learn how to calculate and interpret the mean, median, and mode of a data set.
- Measures of Dispersion: Explore measures such as range, variance, and standard deviation to understand the spread of the data.
- Data Visualization: Use graphs, charts, and diagrams (e.g., bar graphs, histograms, box plots) to represent and analyze data visually.
- Probability and Distributions: Understand basic concepts of probability and explore different types of distributions, such as normal distribution.
Study Tips
Here are some tips for effectively studying and mastering the topic of analyzing data:
- Review the basics: Make sure to understand the fundamentals of data types, measures of central tendency, and measures of dispersion.
- Practice calculations: Work on various problems involving mean, median, mode, range, variance, and standard deviation to strengthen your skills.
- Interpret graphs: Practice interpreting different types of graphs and understanding the information they convey about the data.
- Explore real-world examples: Look for real-life scenarios where data analysis is used, and try to analyze and interpret the data in those contexts.
- Seek help if needed: If you encounter challenges, don't hesitate to ask your teacher or tutor for clarification and additional assistance.
Example Problem
Suppose you have the following set of test scores: 85, 76, 92, 88, 79, 90, 84, 91, 87, 83. Calculate the mean, median, and mode of the scores, and create a bar graph to represent the data.
Solution:
Mean: (85 + 76 + 92 + 88 + 79 + 90 + 84 + 91 + 87 + 83) / 10 = 855 / 10 = 85.5
Median: Since there are 10 scores, the median is the average of the 5th and 6th scores, which are 85 and 88. So, the median is (85 + 88) / 2 = 86.5.
Mode: The mode is 85, as it appears most frequently in the set.
Bar Graph: (Create a bar graph representing the test scores)
Conclusion
By thoroughly understanding the concepts of analyzing data and practicing related problems, you can develop strong analytical skills and make meaningful interpretations from numerical information. Keep practicing and exploring real-world examples to solidify your understanding of this important mathematical topic.
[Analyze The Data] Related Worksheets and Study Guides:
.◂Math Worksheets and Study Guides Eighth Grade. Collecting and describing data

 Worksheet/Answer key
 Worksheet/Answer key
 Worksheet/Answer key
