Statistical Observations
Statistical observations involve collecting, organizing, and interpreting data to make informed decisions. This process is crucial in various fields such as science, business, and social sciences. By analyzing statistical observations, we can identify patterns, trends, and relationships within the data.
Key Concepts
- Data Collection: Gathering data through surveys, experiments, or observations.
- Data Organization: Sorting and categorizing the collected data.
- Data Representation: Presenting the data using graphs, charts, and tables.
- Measures of Central Tendency: Calculating the mean, median, and mode to understand the central values of the data.
- Measures of Dispersion: Analyzing the spread or variability of the data using range, variance, and standard deviation.
- Correlation and Regression: Examining the relationship between two or more variables in the data set.
Study Guide
When studying statistical observations, it's essential to grasp the following topics:
- Understand the difference between qualitative and quantitative data.
- Learn how to collect and record data accurately.
- Master the techniques for organizing and representing data effectively.
- Practice calculating measures of central tendency and dispersion.
- Explore real-life examples of correlation and regression analysis.
Additionally, familiarize yourself with the different types of graphs and charts used in statistics, such as bar graphs, histograms, pie charts, and scatter plots.
By mastering these concepts and skills, you'll be well-equipped to analyze and interpret statistical observations with confidence.
[Statistical Observations] Related Worksheets and Study Guides:
.◂Math Worksheets and Study Guides Eighth Grade. Solving equations and inequalities
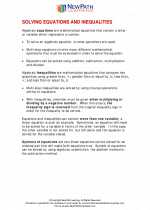
Study Guide Solving equations and inequalities
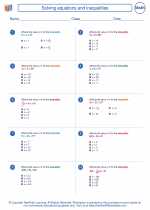
  Worksheet/Answer key
 Solving equations and inequalities
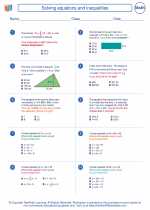
  Worksheet/Answer key
 Solving equations and inequalities
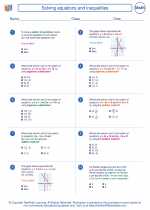
  Worksheet/Answer key
 Solving equations and inequalities

 Worksheet/Answer key
 Worksheet/Answer key
 Worksheet/Answer key

The resources above cover the following skills:
Algebra (NCTM)
Represent and analyze mathematical situations and structures using algebraic symbols.
Develop an initial conceptual understanding of different uses of variables.