Using graphs to analyze data -> observances
Study Guide: Observances in Mathematics
1. Patterns and Sequences
Patterns and sequences are fundamental to observances in mathematics. Look for and identify patterns in numbers, shapes, and algebraic expressions. Practice extending and creating sequences based on observed patterns.
2. Data Analysis
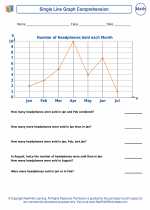
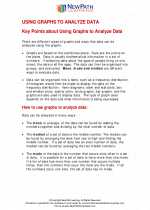
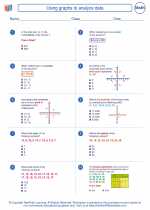
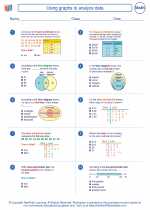
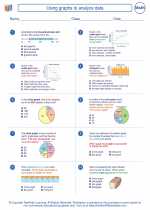
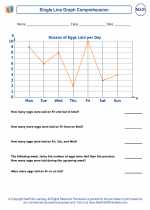
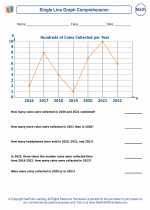
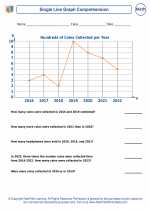
Engage in data observances by analyzing and interpreting data sets. Look for trends, relationships, and outliers in the data. Use visual representations such as charts, graphs, and tables to aid in your observations.
3. Geometry and Symmetry
Observe geometric shapes and figures to identify symmetrical properties. Look for lines of symmetry, rotational symmetry, and reflective symmetry in various shapes. Practice visualizing and describing these symmetrical properties.
4. Problem Solving
Apply observances to problem-solving scenarios. Carefully observe the given information and constraints in a problem. Look for patterns or relationships that can help you devise a solution strategy.
5. Mathematical Reasoning
Develop your mathematical reasoning skills by justifying your observances. Explain why a certain pattern exists, how you arrived at a particular conclusion, or why a certain relationship holds true. Use logical reasoning to support your observances.
[Observances] Related Worksheets and Study Guides:
.◂Math Worksheets and Study Guides Eighth Grade. Using graphs to analyze data
 Worksheet/Answer key
 Worksheet/Answer key
 Worksheet/Answer key
 Worksheet/Answer key
 Worksheet/Answer key
 Worksheet/Answer key
 Worksheet/Answer key