Pie Chart
A pie chart is a circular statistical graphic that is divided into slices to illustrate numerical proportions. The arc length of each slice is proportional to the quantity it represents. It is a useful way to show the relationship of parts to a whole, such as the distribution of a set of data.
Key Features of a Pie Chart
- Circular Structure: The pie chart is shaped like a circle, with the entire circle representing 100% of the data.
- Slices: The circle is divided into slices, with each slice representing a different category or data point. The size of each slice is proportional to the value it represents.
- Labels: Each slice is typically labeled with the category or data point it represents, along with the percentage or actual value it represents.
Uses of Pie Charts
Pie charts are commonly used to display categorical data and illustrate the proportion of each category in relation to the whole. They are often used in business presentations, research reports, and educational materials to visually represent data distribution.
Creating a Pie Chart
To create a pie chart, you can use various software tools such as Microsoft Excel, Google Sheets, or specialized data visualization software. These tools allow you to input your data and generate a pie chart with customizable colors, labels, and other visual elements.
Conclusion
Pie charts offer a simple and intuitive way to represent data distribution and proportions. When used effectively, they can help viewers quickly understand the relative sizes of different categories within a dataset.
[Pie Chart] Related Worksheets and Study Guides:
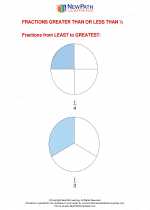
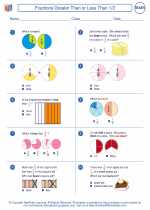
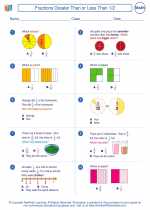
.◂Math Worksheets and Study Guides Second Grade. Fractions Greater Than or Less Than 1/2
 Worksheet/Answer key
 Worksheet/Answer key
 Worksheet/Answer key
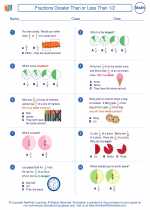
 Worksheet/Answer key
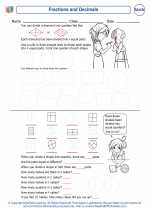
 Worksheet/Answer key
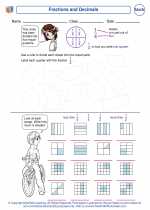
 Vocabulary/Answer key