Represent Data
Representing data is the process of organizing and displaying information in a visual format such as graphs, charts, and tables. It helps to make the data easier to understand and analyze.
Types of Data Representation
- Bar Graphs: Bar graphs use bars to represent and compare the size of different categories of data. They are useful for showing how a category changes over time or comparing different categories at a single point in time.
- Line Graphs: Line graphs display data points connected by lines. They are used to show how data changes over a continuous interval or time period.
- Pie Charts: Pie charts represent data in a circular graph, with each category shown as a slice of the pie. They are useful for showing the proportion of each category in relation to the whole.
- Tables: Tables organize data into rows and columns, making it easy to compare different categories and values.
Steps to Represent Data
- Collect Data: Gather the information you want to represent.
- Choose the Right Graph/Chart: Select the most appropriate type of graph or chart for your data.
- Create the Graph/Chart: Use graphing tools or software to input the data and generate the visual representation.
- Label and Title: Add labels to the x and y-axes, and give the graph a title to clearly convey the information.
- Analyze and Interpret: Once the data is represented, analyze the graph to draw conclusions and make interpretations.
Study Guide
To effectively represent data, it's important to understand the types of graphs and charts and when to use each one. Practice creating different types of graphs and interpreting the information they convey. Here are some key points to remember:
- Bar graphs are used to compare different categories at a single point in time or to show the change in a category over time.
- Line graphs are useful for showing trends and changes over a continuous interval or time period.
- Pie charts are used to represent the proportion of each category in relation to the whole.
- Tables are effective for organizing large sets of data and making comparisons between different categories.
- When representing data, always ensure that the graph is clearly labeled and titled for easy interpretation.
Practicing with real-world data sets and working on various graphing and charting exercises will help reinforce the concepts of representing data effectively.
.◂Math Worksheets and Study Guides Fourth Grade. Represent Data
Study Guide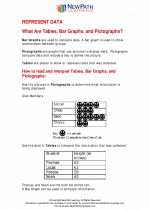 Represent Data
  Worksheet/Answer key
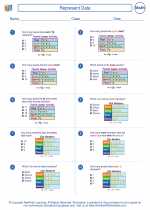 Represent Data
  Worksheet/Answer key
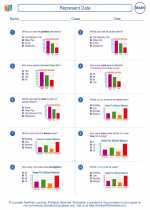 Represent Data
  Worksheet/Answer key
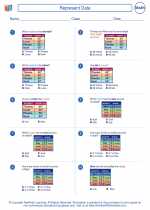 Represent Data
  Worksheet/Answer key
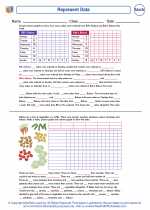 Represent Data
  Worksheet/Answer key
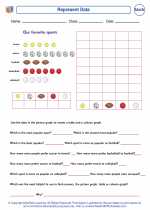 Represent Data
  Worksheet/Answer key
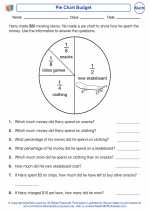 Pie Chart Budget
  Worksheet/Answer key
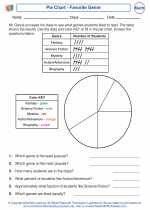 Pie Chart - Favorite Genre

 Worksheet/Answer key
 Worksheet/Answer key
 Worksheet/Answer key
 Worksheet/Answer key
 Worksheet/Answer key
 Worksheet/Answer key
 Worksheet/Answer key

The resources above cover the following skills:
Measurement and Data (MD)
Represent and interpret data.
Supporting Standard: Make a line plot to display a data set of measurements in fractions of a unit (1/2, 1/4, 1/8). Solve problems involving addition and subtraction of fractions by using information presented in line plots. For example, from a line plot find and interpret the difference in length between the longest and shortest specimens in an insect collection.
See the skills and knowledge that are stated in the Standard.