Pie Chart
A pie chart is a circular statistical graphic that is divided into slices to illustrate numerical proportions. Each slice of the pie chart represents a proportion of the whole. The entire "pie" represents 100% of a whole, while each individual slice represents a percentage or proportion of that total.
Pie charts are useful for showing the proportionate size of each category within a data set. They are often used to visualize the distribution of a categorical variable and make it easier to understand the relationship between the parts and the whole.
Creating a Pie Chart
To create a pie chart, you need the data that you want to represent. The data should be divided into categories, and the percentage or proportion of each category should be calculated. Once you have the data, you can use software tools like Excel, Google Sheets, or programming languages like Python to create a pie chart.
Using a Pie Chart
When interpreting a pie chart, it's important to pay attention to the size of each slice relative to the whole pie. The colors or patterns used for each slice can help differentiate between the categories. Additionally, including a legend or labels can provide more information about each category represented in the pie chart.
Conclusion
Pie charts are a valuable tool for visualizing the distribution of categorical data and understanding the proportions of different categories within a data set. They provide a clear and intuitive representation of proportions, making it easier to grasp the relative sizes of different categories.
[Pie Chart] Related Worksheets and Study Guides:
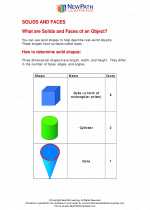
.◂Math Worksheets and Study Guides Third Grade. Solids and Faces
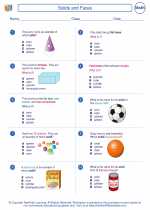
 Worksheet/Answer key
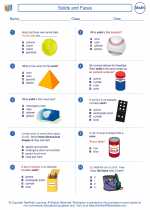
 Worksheet/Answer key
 Worksheet/Answer key
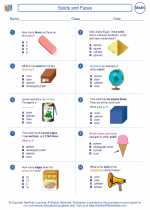
 Worksheet/Answer key
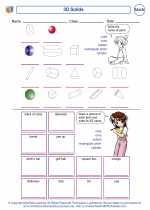
 Worksheet/Answer key