Study Guide: Pictographs
- Definition: A pictograph is a visual representation of data using pictures or symbols.
- Steps to Create a Pictograph:
- Choose a symbol to represent the data.
- Establish a key to explain the relationship between the symbol and the quantity it represents.
- Draw the pictograph using the chosen symbol and key.
- Interpret the pictograph to understand the data being conveyed.
- Example: Representing the number of apples sold at a grocery store with apple symbols.
◂Math Worksheets and Study Guides Third Grade. Temperature
Study Guide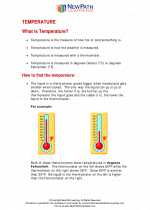 Temperature
  Activity Lesson
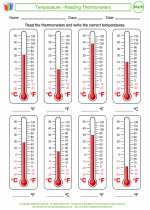 Temperature - Reading Thermometers
  Worksheet/Answer key
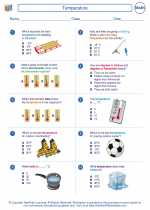 Temperature
  Worksheet/Answer key
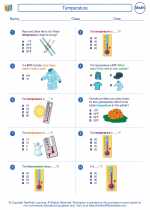 Temperature
  Worksheet/Answer key
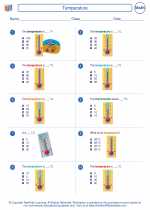 Temperature

 Activity Lesson
 Worksheet/Answer key
 Worksheet/Answer key
 Worksheet/Answer key

The resources above cover the following skills:
Measurement (NCTM)
Apply appropriate techniques, tools, and formulas to determine measurements.
Select and apply appropriate standard units and tools to measure length, area, volume, weight, time, temperature, and the size of angles.