Line Chart Study Guide
Definition
A line chart is a type of graph that displays information as a series of data points called 'markers' connected by straight line segments. It is commonly used to show how data changes over time or to compare data sets.
Key Features of a Line Chart
- Data Points: Each data point represents a value at a specific point in time or category.
- Lines: Lines connect the data points, making it easy to see the overall trend or pattern in the data.
- Axes: The x-axis (horizontal) typically represents time or categories, while the y-axis (vertical) represents the numerical values being measured.
- Title and Labels: A line chart should have a title and labeled axes to provide context and clarity.
Advantages of Using Line Charts
- Easy to interpret and understand trends over time.
- Useful for showing relationships between two or more variables.
- Can highlight changes and patterns in data.
- Effective for displaying large data sets in a clear and organized manner.
How to Create a Line Chart
- Organize your data into categories and corresponding numerical values.
- Choose the appropriate scale for the axes to ensure all data points are visible and the trends are clear.
- Plot the data points on the chart and connect them with lines.
- Add a title and label the axes for clarity.
- Review and analyze the chart to identify any patterns or trends in the data.
Example of a Line Chart
Below is an example of a simple line chart showing the average temperature over a week:
 Line Chart">
Conclusion
Line charts are a valuable tool for visualizing and analyzing data trends over time. Understanding how to create and interpret line charts is an important skill in various fields, including mathematics, economics, and science.
.◂Math Worksheets and Study Guides Fourth Grade. Measurement
Study Guide Measurement
  Activity Lesson
 Comparing Volume Capacities
  Activity Lesson
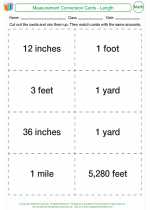 Measurement Conversion Cards
  Activity Lesson
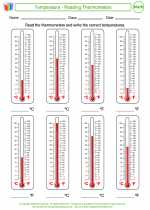 Temperature - Reading Thermometers
  Worksheet/Answer key
 Measurement
  Worksheet/Answer key
 Measurement
  Worksheet/Answer key
 Measurement
  Worksheet/Answer key
 Measurement
  Worksheet/Answer key
 Measurement
  Worksheet/Answer key
 Measurement
  Worksheet/Answer key
 Units of Measurement
  Worksheet/Answer key
 Length
  Worksheet/Answer key
 Measurement & Money Crossword
  Worksheet/Answer key
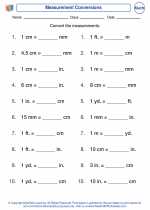 Measurement Conversions
  Vocabulary/Answer key
 Measurement
  Vocabulary/Answer key
 Measurement
  Vocabulary/Answer key
 Measurement

 Activity Lesson
 Activity Lesson
 Activity Lesson
 Worksheet/Answer key
 Worksheet/Answer key
 Worksheet/Answer key
 Worksheet/Answer key
 Worksheet/Answer key
 Worksheet/Answer key
 Worksheet/Answer key
 Worksheet/Answer key
 Worksheet/Answer key
 Worksheet/Answer key
 Vocabulary/Answer key
 Vocabulary/Answer key
 Vocabulary/Answer key

The resources above cover the following skills:
Measurement (NCTM)
Understand measurable attributes of objects and the units, systems, and processes of measurement.
Understand such attributes as length, area, weight, volume, and size of angle and select the appropriate type of unit for measuring each attribute.
Understand the need for measuring with standard units and become familiar with standard units in the customary and metric systems.
Understand that measurements are approximations and how differences in units affect precision.
Apply appropriate techniques, tools, and formulas to determine measurements.
Select and apply appropriate standard units and tools to measure length, area, volume, weight, time, temperature, and the size of angles.