Charts
A chart is a visual representation of data in the form of graphs, diagrams, or tables. Charts are used to make data easier to understand and analyze, and they are commonly used in various fields such as business, science, and education.
Types of Charts
There are several types of charts commonly used to represent different types of data:
- Bar Charts: Bar charts represent data using rectangular bars of varying lengths. They are used to compare different categories of data.
- Line Charts: Line charts display data as points connected by lines. They are often used to show trends over a period of time.
- Pie Charts: Pie charts represent data as a circle divided into segments, with each segment representing a proportion of the whole.
- Scatter Plots: Scatter plots display individual data points on a graph to show the relationship between two variables.
- Histograms: Histograms are similar to bar charts but are used to represent frequency distributions of continuous data.
How to Read a Chart
When reading a chart, it's important to understand the following elements:
- Title: The title of the chart provides information about the data being represented.
- Axis Labels: The x-axis and y-axis labels indicate the categories or values being compared in the chart.
- Legend: The legend explains the meaning of different colors or symbols used in the chart.
- Data Points: Data points represent specific values or categories in the chart.
How to Create a Chart
To create a chart, follow these steps:
- Choose the Right Chart Type: Select the appropriate chart type based on the type of data you want to represent.
- Organize Your Data: Arrange your data in a clear and organized manner, with labels and categories if necessary.
- Select a Tool: Use a software tool such as Microsoft Excel, Google Sheets, or a charting library to create your chart.
- Input Your Data: Input your data into the charting tool and customize the chart as needed.
- Label Your Chart: Add a title, axis labels, and a legend to make your chart easy to understand.
Study Guide
Here are some key points to remember when studying charts:
- Understand the different types of charts and when to use each type.
- Learn how to read and interpret charts, including understanding titles, axis labels, legends, and data points.
- Practice creating charts using software tools and organizing data effectively.
- Explore real-world examples of charts in different fields to understand their practical applications.
By mastering the concepts of charts, you will be able to effectively analyze and present data in a visual format, making it easier for others to understand and draw insights from the information.
[Charts] Related Worksheets and Study Guides:
.◂Math Worksheets and Study Guides Fourth Grade. Measurement
Study Guide Measurement
  Activity Lesson
 Comparing Volume Capacities
  Activity Lesson
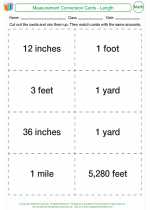 Measurement Conversion Cards
  Activity Lesson
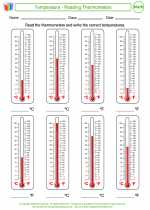 Temperature - Reading Thermometers
  Worksheet/Answer key
 Measurement
  Worksheet/Answer key
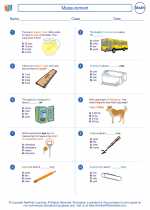 Measurement
  Worksheet/Answer key
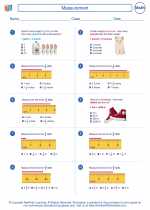 Measurement
  Worksheet/Answer key
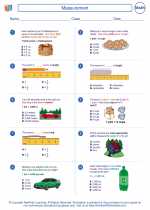 Measurement
  Worksheet/Answer key
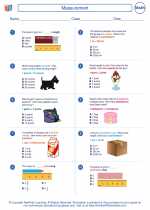 Measurement
  Worksheet/Answer key
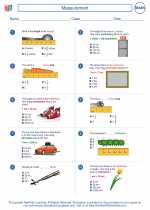 Measurement
  Worksheet/Answer key
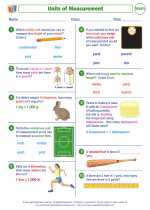 Units of Measurement
  Worksheet/Answer key
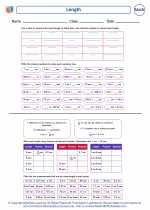 Length
  Worksheet/Answer key
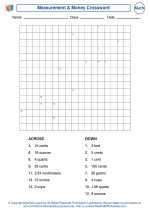 Measurement & Money Crossword
  Worksheet/Answer key
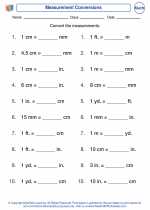 Measurement Conversions
  Vocabulary/Answer key
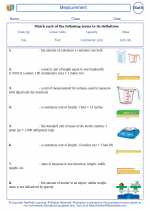 Measurement
  Vocabulary/Answer key
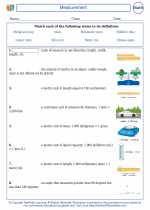 Measurement
  Vocabulary/Answer key
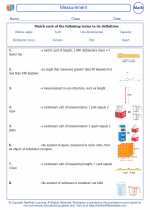 Measurement

 Activity Lesson
 Activity Lesson
 Activity Lesson
 Worksheet/Answer key
 Worksheet/Answer key
 Worksheet/Answer key
 Worksheet/Answer key
 Worksheet/Answer key
 Worksheet/Answer key
 Worksheet/Answer key
 Worksheet/Answer key
 Worksheet/Answer key
 Worksheet/Answer key
 Vocabulary/Answer key
 Vocabulary/Answer key
 Vocabulary/Answer key

The resources above cover the following skills:
Measurement (NCTM)
Understand measurable attributes of objects and the units, systems, and processes of measurement.
Understand such attributes as length, area, weight, volume, and size of angle and select the appropriate type of unit for measuring each attribute.
Understand the need for measuring with standard units and become familiar with standard units in the customary and metric systems.
Understand that measurements are approximations and how differences in units affect precision.
Apply appropriate techniques, tools, and formulas to determine measurements.
Select and apply appropriate standard units and tools to measure length, area, volume, weight, time, temperature, and the size of angles.