Line Graphs
A line graph is a type of chart used to display data that changes continuously over time. It is particularly useful for showing trends and patterns in the data. Line graphs are made up of points connected by straight lines, which visually represent the relationship between the data points.
Key Components of a Line Graph:
- X-Axis: The horizontal axis that represents the independent variable (e.g., time, distance).
- Y-Axis: The vertical axis that represents the dependent variable (e.g., temperature, sales).
- Data Points: Individual values plotted on the graph.
- Line: The line that connects the data points to show the trend or change over time.
- Title: A descriptive title that summarizes the data being displayed.
- Legend: A key that explains the meaning of different lines or colors on the graph, if applicable.
How to Create a Line Graph:
- Collect your data and organize it into a table with two columns (X-axis and Y-axis).
- Choose a suitable scale for the X and Y-axes that allows your data to fit well on the graph.
- Plot the data points on the graph, with each point representing the value of the dependent variable at a specific value of the independent variable.
- Connect the data points with a line to show the trend or pattern in the data.
- Add a title, labels for the X and Y-axes, and a legend if needed.
Interpreting a Line Graph:
When interpreting a line graph, pay attention to the direction and steepness of the line, as they indicate the rate of change in the data. A steep upward line indicates rapid growth, while a steep downward line indicates rapid decline. A horizontal line suggests no change over time. Additionally, look for any patterns or fluctuations in the data that may be significant.
Study Guide Questions:
.◂Math Worksheets and Study Guides Fifth Grade. Adding Fractions
Study Guide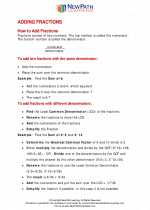 Adding Fractions
  Worksheet/Answer key
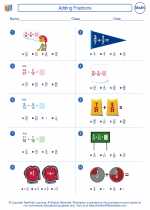 Adding Fractions Worksheet/Answer key
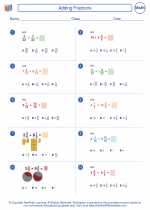 Adding Fractions Worksheet/Answer key
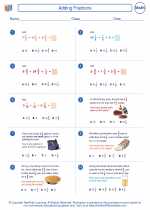 Adding Fractions
Worksheet/Answer keyWorksheet/Answer keyWorksheet/Answer keyCreate And Print more Fractions worksheets with Comparing Fractions, Equivalent Fractions, and Simplifying Fractions
The resources above cover the following skills:
Number and Operations (NCTM)
Understand numbers, ways of representing numbers, relationships among numbers, and number systems.
Develop understanding of fractions as parts of unit wholes, as parts of a collection, as locations on number lines, and as divisions of whole numbers.
Compute fluently and make reasonable estimates.
Use visual models, benchmarks, and equivalent forms to add and subtract commonly used fractions and decimals.
Algebra (NCTM)
Use mathematical models to represent and understand quantitative relationships.
Model problem situations with objects and use representations such as graphs, tables, and equations to draw conclusions.
Connections to the Grade 5 Focal Points (NCTM)
Algebra: Students use patterns, models, and relationships as contexts for writing and solving simple equations and inequalities. They create graphs of simple equations. They explore prime and composite numbers and discover concepts related to the addition and subtraction of fractions as they use factors and multiples, including applications of common factors and common multiples. They develop an understanding of the order of operations and use it for all operations.