Histogram
A histogram is a type of bar graph that represents the distribution of data. It is used to show the frequency of values within a data set. In a histogram, the horizontal axis represents the range of values, and the vertical axis represents the frequency or relative frequency of those values.
Key Concepts
- Frequency: The number of times a particular value occurs in the data set.
- Range: The span of values covered by the data set.
- Bar Height: The height of each bar in the histogram represents the frequency or relative frequency of the corresponding value.
- Intervals: The range of values is divided into intervals or bins, and each bar represents the frequency of values within that interval.
Creating a Histogram
To create a histogram, follow these steps:
- Determine the range of the data set.
- Divide the range into intervals or bins.
- Count the frequency of values within each interval.
- Draw a bar for each interval, with the height of the bar representing the frequency of values within that interval.
Example
Suppose we have the following data set representing the scores of 20 students in a math test:
| Score | 85 | 92 | 78 | 90 | 72 | 85 | 88 | 75 | 83 | 92 | 80 | 85 | 78 | 90 | 88 | 82 | 85 | 90 | 88 | 78 |
|---|
Let's create a histogram to represent this data:

Study Tips
Here are some tips for studying histograms:
- Practice creating histograms from given data sets.
- Understand the concept of frequency and how it relates to the height of the bars in a histogram.
- Study different types of histograms, such as relative frequency histograms and cumulative frequency histograms.
- Learn to interpret histograms and draw conclusions about the distribution of data.
With these study tips and a good understanding of the key concepts, you'll be well-prepared to work with histograms in your math studies!
.◂Math Worksheets and Study Guides Fifth Grade. Algebra
Study Guide Algebra
  Activity Lesson
 Algebra
  Activity Lesson
 Algebraic Expressions
  Activity Lesson
 Combining Like Terms
  Activity Lesson
 Building a Nest Egg
  Worksheet/Answer key
 Algebra
  Worksheet/Answer key
 Algebra
  Worksheet/Answer key
 Algebra
  Worksheet/Answer key
 Introduction to Algebra
  Worksheet/Answer key
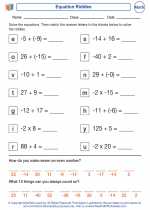 Equation Riddles
  Worksheet/Answer key
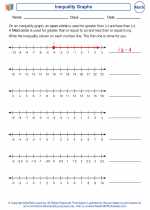 Inequality Graphs
  Worksheet/Answer key
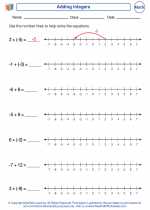 Adding Integers
  Vocabulary/Answer key
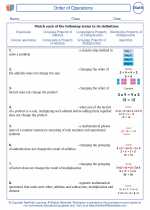 Algebra

 Activity Lesson
 Activity Lesson
 Activity Lesson
 Activity Lesson
 Worksheet/Answer key
 Worksheet/Answer key
 Worksheet/Answer key
 Worksheet/Answer key
 Worksheet/Answer key
 Worksheet/Answer key
 Worksheet/Answer key
 Vocabulary/Answer key

The resources above cover the following skills:
Number and Operations (NCTM)
Understand meanings of operations and how they relate to one another.
Understand various meanings of multiplication and division.
Identify and use relationships between operations, such as division as the inverse of multiplication, to solve problems.
Connections to the Grade 5 Focal Points (NCTM)
Algebra: Students use patterns, models, and relationships as contexts for writing and solving simple equations and inequalities. They create graphs of simple equations. They explore prime and composite numbers and discover concepts related to the addition and subtraction of fractions as they use factors and multiples, including applications of common factors and common multiples. They develop an understanding of the order of operations and use it for all operations.