Histograms
A histogram is a graphical representation of the distribution of numerical data. It consists of a series of rectangles or bars, each representing a specific range of values, and the height of each bar corresponds to the frequency or relative frequency of the values within that range.
Key Terminology
- Bars: The rectangles or bars that represent the different value ranges.
- X-axis: The horizontal axis that represents the different value ranges or intervals.
- Y-axis: The vertical axis that represents the frequency or relative frequency of the values within each range.
- Frequency: The number of data points that fall within a specific range.
- Relative Frequency: The proportion of data points that fall within a specific range, calculated by dividing the frequency by the total number of data points.
Creating a Histogram
To create a histogram, follow these steps:
- Choose the appropriate number of intervals for the data.
- Determine the range of the data and the width of each interval.
- Count the number of data points that fall within each interval to determine the frequency for each interval.
- Calculate the relative frequency for each interval.
- Draw the X-axis and Y-axis, and mark the intervals on the X-axis.
- Draw a bar for each interval, with the height of the bar representing the frequency or relative frequency for that interval.
Interpreting a Histogram
When interpreting a histogram, consider the following:
- The shape of the histogram (e.g., symmetrical, skewed to the left or right, bimodal).
- The center of the data, which can be determined by the peak of the histogram.
- The spread of the data, which can be determined by the width of the bars and the range of the data.
- Any outliers or unusual features in the data.
Study Guide
To study histograms effectively, consider the following tips:
- Understand the key terminology and concepts related to histograms, including bars, intervals, frequency, and relative frequency.
- Practice creating histograms for different sets of data, ensuring that you understand the process of determining intervals, calculating frequencies, and drawing the bars.
- Interpret sample histograms by analyzing the shape, center, spread, and any outliers in the data.
- Compare and contrast histograms with other types of graphs, such as bar graphs and line graphs, to understand when and how to use each type of graph.
- Use real-world examples to apply your knowledge of histograms and understand how they can be used to represent and analyze data in various contexts.
[Histograms] Related Worksheets and Study Guides:
.◂Math Worksheets and Study Guides Fifth Grade. Equivalent Fractions
Study Guide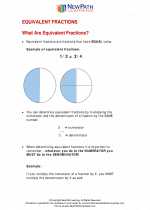 Equivalent Fractions
  Worksheet/Answer key
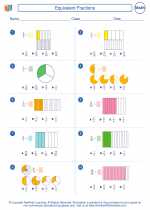 Equivalent Fractions
  Worksheet/Answer key
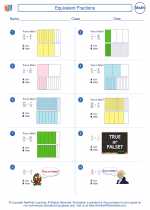 Equivalent Fractions
  Worksheet/Answer key
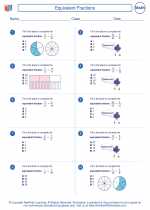 Equivalent Fractions
  Worksheet/Answer key
 Comparing Fractions
  Worksheet/Answer key
 Comparing Fractions
  Vocabulary/Answer key
 Equivalent Fractions

 Worksheet/Answer key
 Worksheet/Answer key
 Worksheet/Answer key
 Worksheet/Answer key
 Worksheet/Answer key
 Vocabulary/Answer key

Create And Print more Fractions worksheets with Comparing Fractions, Equivalent Fractions, and Simplifying Fractions
The resources above cover the following skills:
Number and Operations (NCTM)
Understand numbers, ways of representing numbers, relationships among numbers, and number systems.
Develop understanding of fractions as parts of unit wholes, as parts of a collection, as locations on number lines, and as divisions of whole numbers.
Recognize and generate equivalent forms of commonly used fractions, decimals, and percents.
Algebra (NCTM)
Use mathematical models to represent and understand quantitative relationships.
Model problem situations with objects and use representations such as graphs, tables, and equations to draw conclusions.