Graphs and Tables Study Guide
Graphs
A graph is a visual representation of data that helps us to better understand and interpret numerical information. There are several types of graphs, including:
- Bar Graph: A graph that uses rectangular bars to represent and compare different categories of data.
- Line Graph: A graph that uses points connected by lines to show how data changes over time or other continuous intervals.
- Pie Chart: A circular graph that is divided into sections to represent the proportion of a whole.
- Scatter Plot: A graph that uses points to show the relationship between two sets of data.
Tables
A table is a way of organizing data in rows and columns, making it easier to compare and analyze information. Tables are often used to display numerical data and can be used to create graphs and charts.
Key Concepts
When working with graphs and tables, it's important to understand the following key concepts:
- Data Interpretation: Understanding how to read and interpret information from graphs and tables.
- Graphing Techniques: Knowing how to create different types of graphs and choose the most appropriate graph for a given set of data.
- Table Analysis: Being able to analyze and draw conclusions from the data presented in tables.
- Trends and Patterns: Identifying trends and patterns in data and being able to explain and interpret them.
Study Tips
Here are some tips for studying and mastering the topic of graphs and tables:
- Practice creating different types of graphs using sample data.
- Work on interpreting information from graphs and tables to understand the relationships between different data sets.
- Look for real-life examples of graphs and tables in newspapers, magazines, and online sources to practice interpreting and analyzing data.
- Review different graphing techniques and when to use each type of graph based on the data being presented.
- Practice identifying trends and patterns in data and explaining their significance.
By mastering the concepts of graphs and tables, you will be better equipped to analyze and interpret numerical information, making it an important skill for a wide range of academic and real-world applications.
.◂Math Worksheets and Study Guides Fifth Grade. Graphs and Tables
Study Guide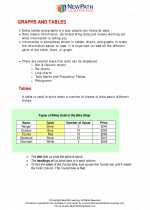 Graphs and Tables
  Worksheet/Answer key
 Graphs and Tables Worksheet/Answer key
 Graphs and Tables Worksheet/Answer key
 Graphs and Tables
Worksheet/Answer keyWorksheet/Answer keyWorksheet/Answer keyThe resources above cover the following skills:
Geometry (NCTM)
Specify locations and describe spatial relationships using coordinate geometry and other representational systems.
Make and use coordinate systems to specify locations and to describe paths.
Connections to the Grade 5 Focal Points (NCTM)
Data Analysis: Students apply their understanding of whole numbers, fractions, and decimals as they construct and analyze double-bar and line graphs and use ordered pairs on coordinate grids.