Bar Chart Study Guide
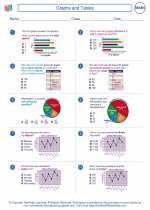
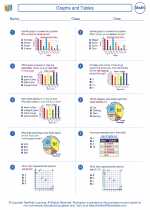
A bar chart is a graphical representation of data in which the length of bars represents the frequency or intensity of the variable being measured. It is a useful way to display and compare the numerical values or frequencies of different categories or groups.
To create a bar chart, follow these steps:
- Identify the categories or groups you want to compare.
- Label the x-axis with the categories or groups.
- Label the y-axis with the numerical values or frequencies.
- Draw bars for each category, with the height of each bar corresponding to the value it represents.
- Ensure the bars are equally spaced and of uniform width.
When interpreting a bar chart, consider the following:
- Compare the heights of the bars to understand the relative differences in values or frequencies.
- Look for trends or patterns in the data, such as which category has the highest or lowest value.
- Use the chart to make comparisons and draw conclusions about the data being represented.
Bar charts are useful for displaying categorical data and are often used in various fields such as statistics, business, and social sciences to visually represent and analyze data.
.◂Math Worksheets and Study Guides Fifth Grade. Graphs and Tables
Study Guide Graphs and Tables
  Worksheet/Answer key
 Graphs and Tables
  Worksheet/Answer key
 Graphs and Tables
  Worksheet/Answer key
 Graphs and Tables

 Worksheet/Answer key
 Worksheet/Answer key
 Worksheet/Answer key

The resources above cover the following skills:
Geometry (NCTM)
Specify locations and describe spatial relationships using coordinate geometry and other representational systems.
Make and use coordinate systems to specify locations and to describe paths.
Connections to the Grade 5 Focal Points (NCTM)
Data Analysis: Students apply their understanding of whole numbers, fractions, and decimals as they construct and analyze double-bar and line graphs and use ordered pairs on coordinate grids.