Organizing Data
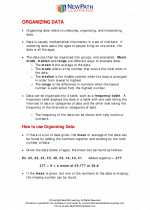
Organizing data is an important skill in mathematics and statistics. It involves arranging and presenting data in a meaningful way to facilitate analysis and interpretation. There are several methods for organizing data including, using tables, charts, graphs, and diagrams. Understanding how to organize data is essential for interpreting and drawing conclusions from the information presented.
Types of Data
Before organizing data, it is important to understand the different types of data. Data can be classified as categorical or numerical.
- Categorical data: This type of data represents characteristics or qualities and is often in the form of labels or categories. Examples include colors, types of cars, or yes/no responses.
- Numerical data: Numerical data represents quantities or measurements and can be further classified as discrete or continuous. Discrete data can only take specific values (e.g., number of siblings), while continuous data can take any value within a range (e.g., height, weight).
Methods of Organizing Data
There are several methods for organizing data:
- Frequency Table: A frequency table is a way to organize and display data by counting the number of times each piece of data occurs. It is useful for summarizing categorical and numerical data.
- Bar Graph: A bar graph is a visual representation of data in which the lengths of bars represent the frequency or relative frequency of the data. It is commonly used to display categorical data.
- Pie Chart: A pie chart is a circular statistical graphic that is divided into slices to illustrate numerical proportion. It is useful for showing the composition of a categorical data set.
- Histogram: A histogram is a graphical display of numerical data that uses bars to represent the frequency of data within specific intervals. It is similar to a bar graph but is used for continuous data.
- Line Graph: A line graph is a type of chart used to display data that changes continuously over time. It is commonly used for showing trends and relationships between variables.
- Scatter Plot: A scatter plot is a graph that shows the relationship between two sets of data. It is useful for determining if there is a correlation between the two sets of data.
Measures of Central Tendency
When organizing numerical data, it is important to understand measures of central tendency, which are used to describe the center of a data set. The main measures of central tendency include:
- Mean: The mean is the average of a data set and is calculated by adding up all the values and dividing by the number of values.
- Median: The median is the middle value of a data set when the values are arranged in ascending or descending order. If there is an even number of values, the median is the average of the two middle values.
- Mode: The mode is the value that appears most frequently in a data set. A data set may have one mode, more than one mode, or no mode at all.
Study Guide
To effectively study the topic of organizing data, consider the following steps:
- Understand the different types of data: categorical and numerical.
- Learn the various methods of organizing data, including frequency tables, graphs, and charts.
- Practice creating and interpreting different types of graphs and charts.
- Review and understand measures of central tendency (mean, median, mode).
- Complete practice problems and exercises to reinforce your understanding of the topic.
Remember to ask your teacher or tutor for help if you encounter any difficulties while studying this topic.
[Organizing Data] Related Worksheets and Study Guides:
.◂Math Worksheets and Study Guides Seventh Grade. Organizing Data

 Worksheet/Answer key
 Worksheet/Answer key
 Worksheet/Answer key
