Charts
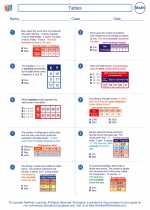
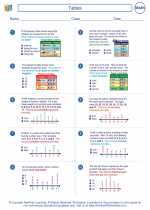
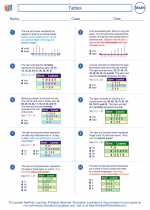
A chart is a visual representation of data, used to easily understand and interpret information. It is a great tool for organizing and presenting data in a way that is easy to comprehend.
Types of Charts
There are several types of charts commonly used to represent data:
- Bar Chart: Uses rectangular bars to represent data.
- Line Chart: Shows data points connected by straight lines.
- Pie Chart: Represents data in a circular graph, with each "slice" representing a proportion of the whole.
- Scatter Plot: Displays individual data points on a graph, typically used to show relationships between two variables.
- Area Chart: Similar to a line chart, but the area between the line and the x-axis is filled with color.
- Histogram: Groups data into intervals and represents the frequency of each interval with bars.
Creating and Interpreting Charts
To create a chart, you first need to have data that you want to represent. Once you have the data, you can select the appropriate type of chart to best represent that data. When interpreting a chart, it's important to understand the scale, labels, and what the chart is representing. Charts are a powerful tool for identifying patterns, trends, and outliers in data.
Study Guide
To better understand charts, consider the following study guide:
- What are the different types of charts commonly used to represent data?
- How do you create a chart from a given set of data?
- What are the important elements to consider when interpreting a chart?
- How can charts help in identifying patterns and trends in data?
- Practice creating and interpreting different types of charts using sample data sets.
Understanding charts is an essential skill for interpreting and analyzing data in various fields such as mathematics, science, economics, and more.


